Improvement
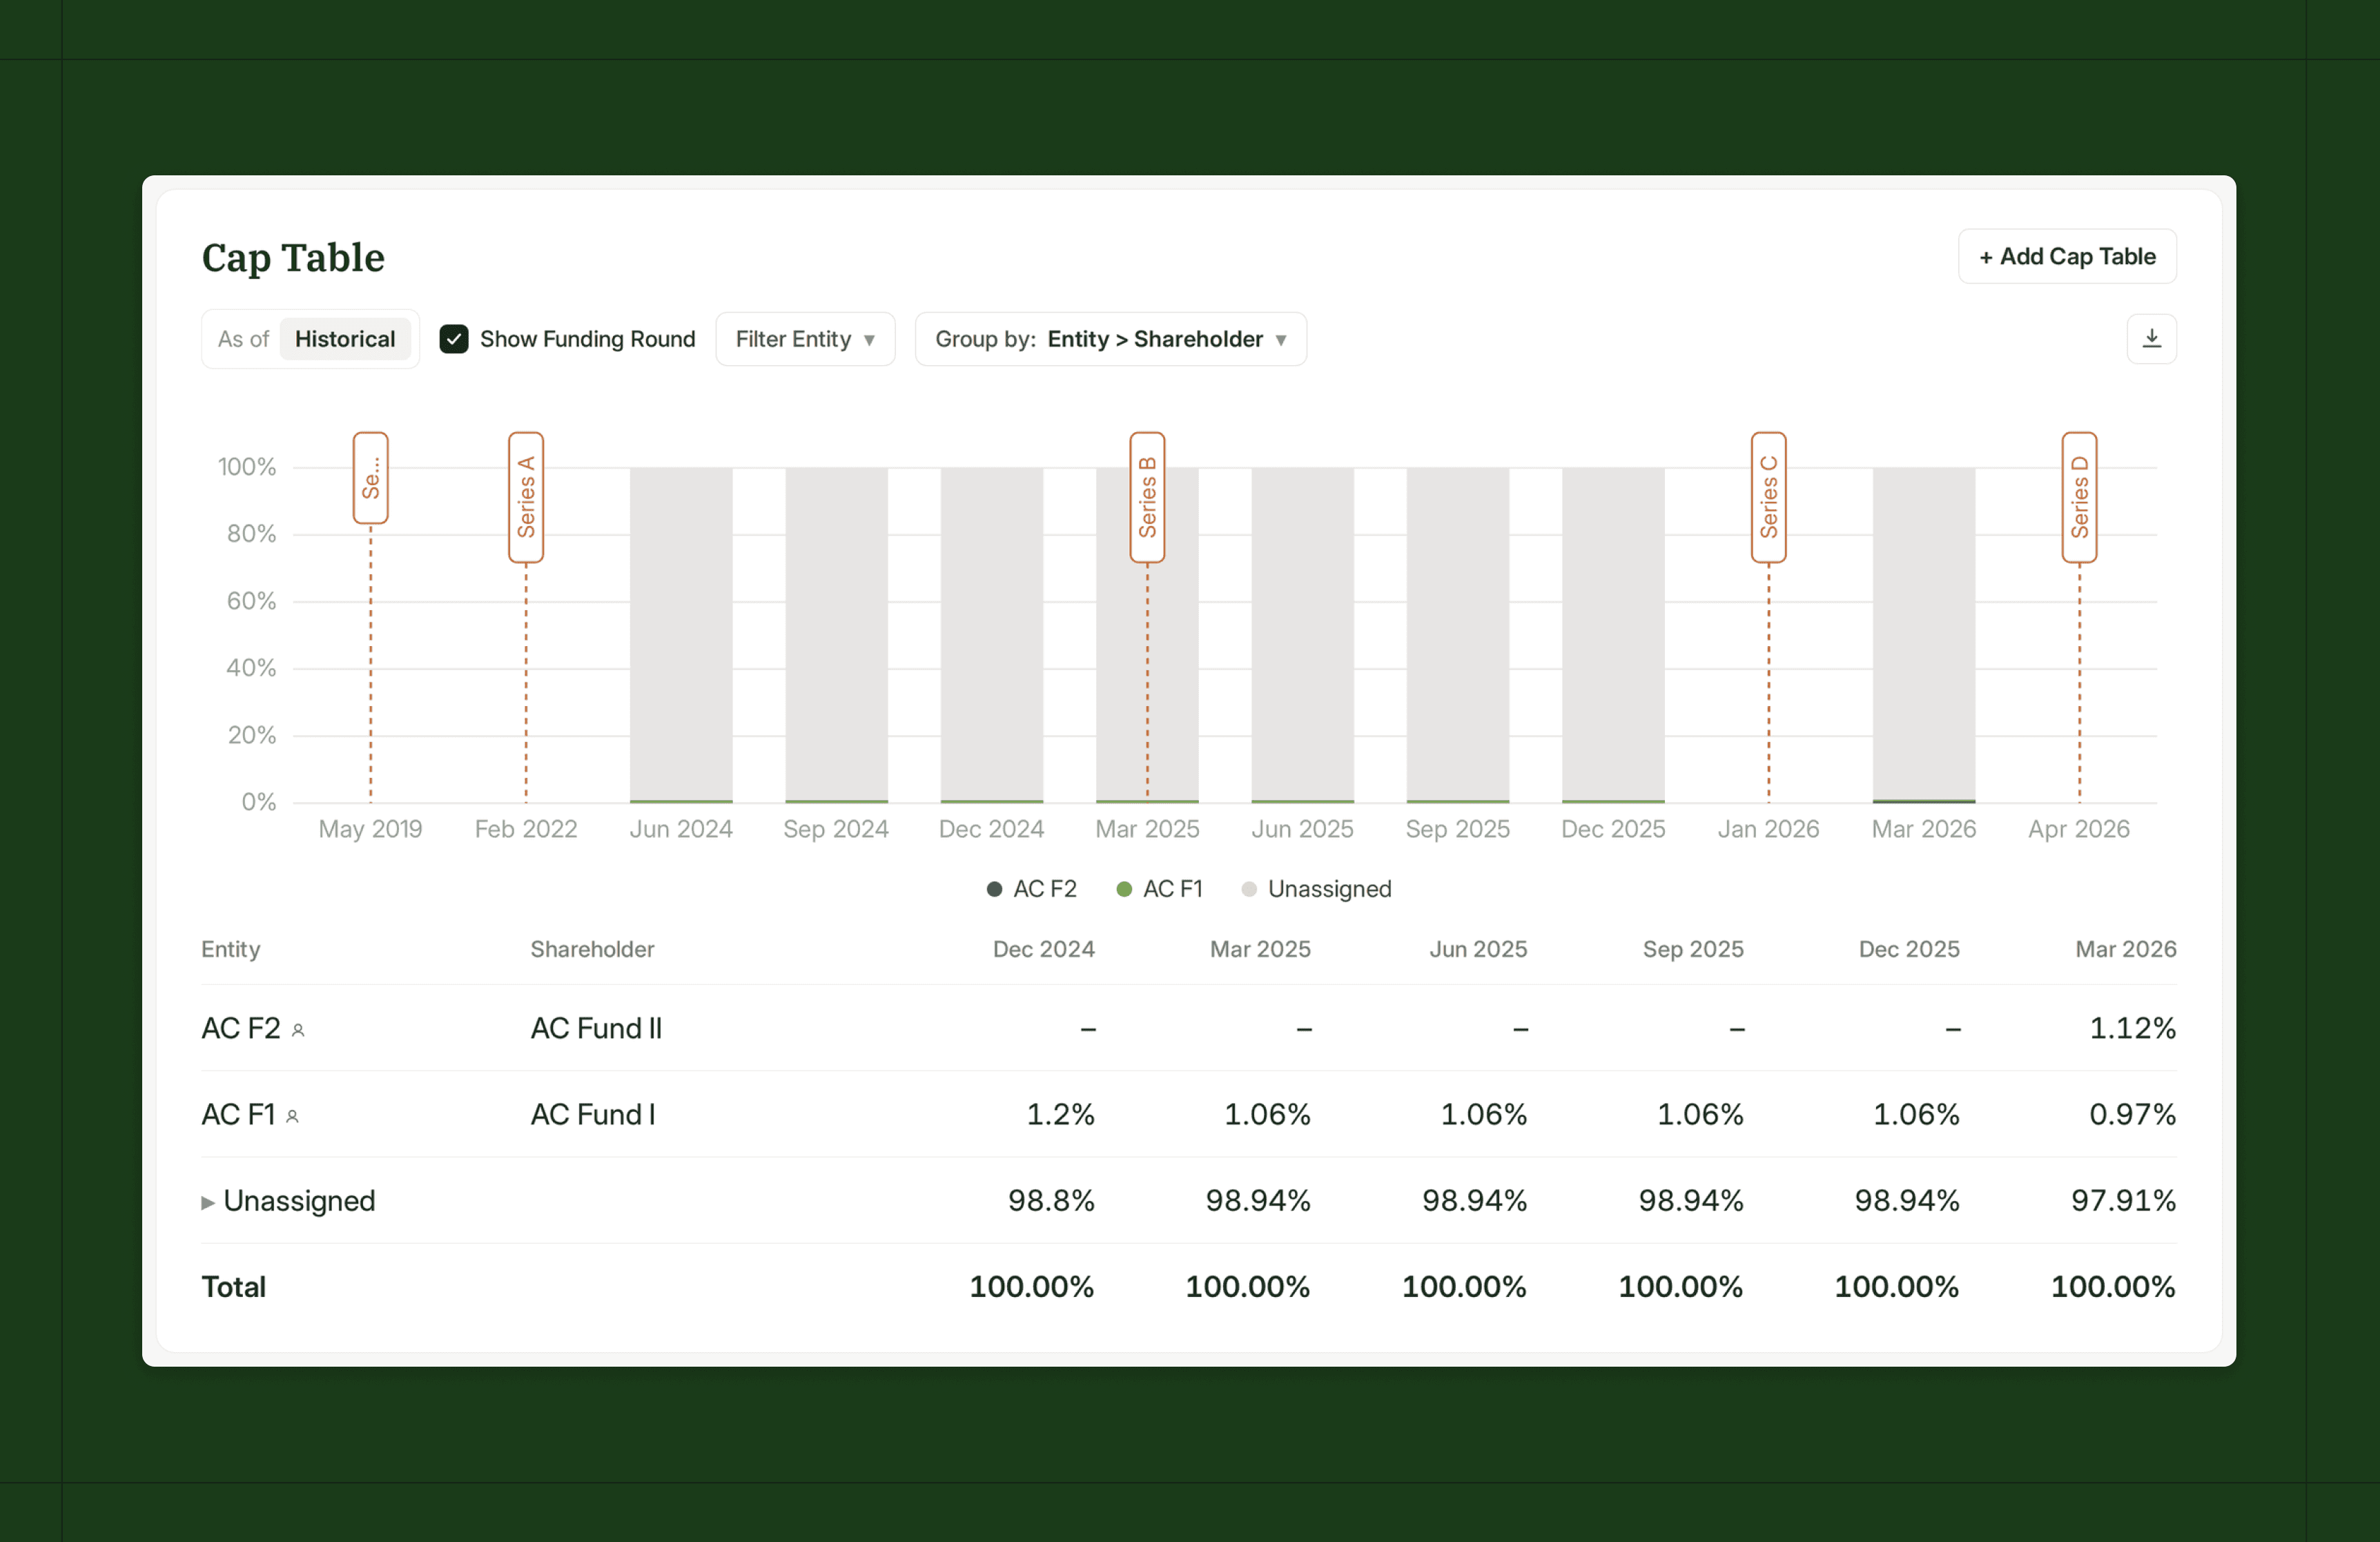
Answering "how much have we been diluted since Series A?" used to mean opening cap table snapshots one at a time and comparing numbers manually. The new Historical tab lays every snapshot side by side in a single time series.
The dilution story: See who entered, who got diluted, and by how much across every financing event. Your own fund is always highlighted.
Every holder, every period: Access exact ownership percentages for every holder at any point in time, with funding rounds marked directly on the timeline.
Cut through the noise: Pin a specific holder to isolate their ownership over time, or filter down to a focused group of key holders.


