Improvement
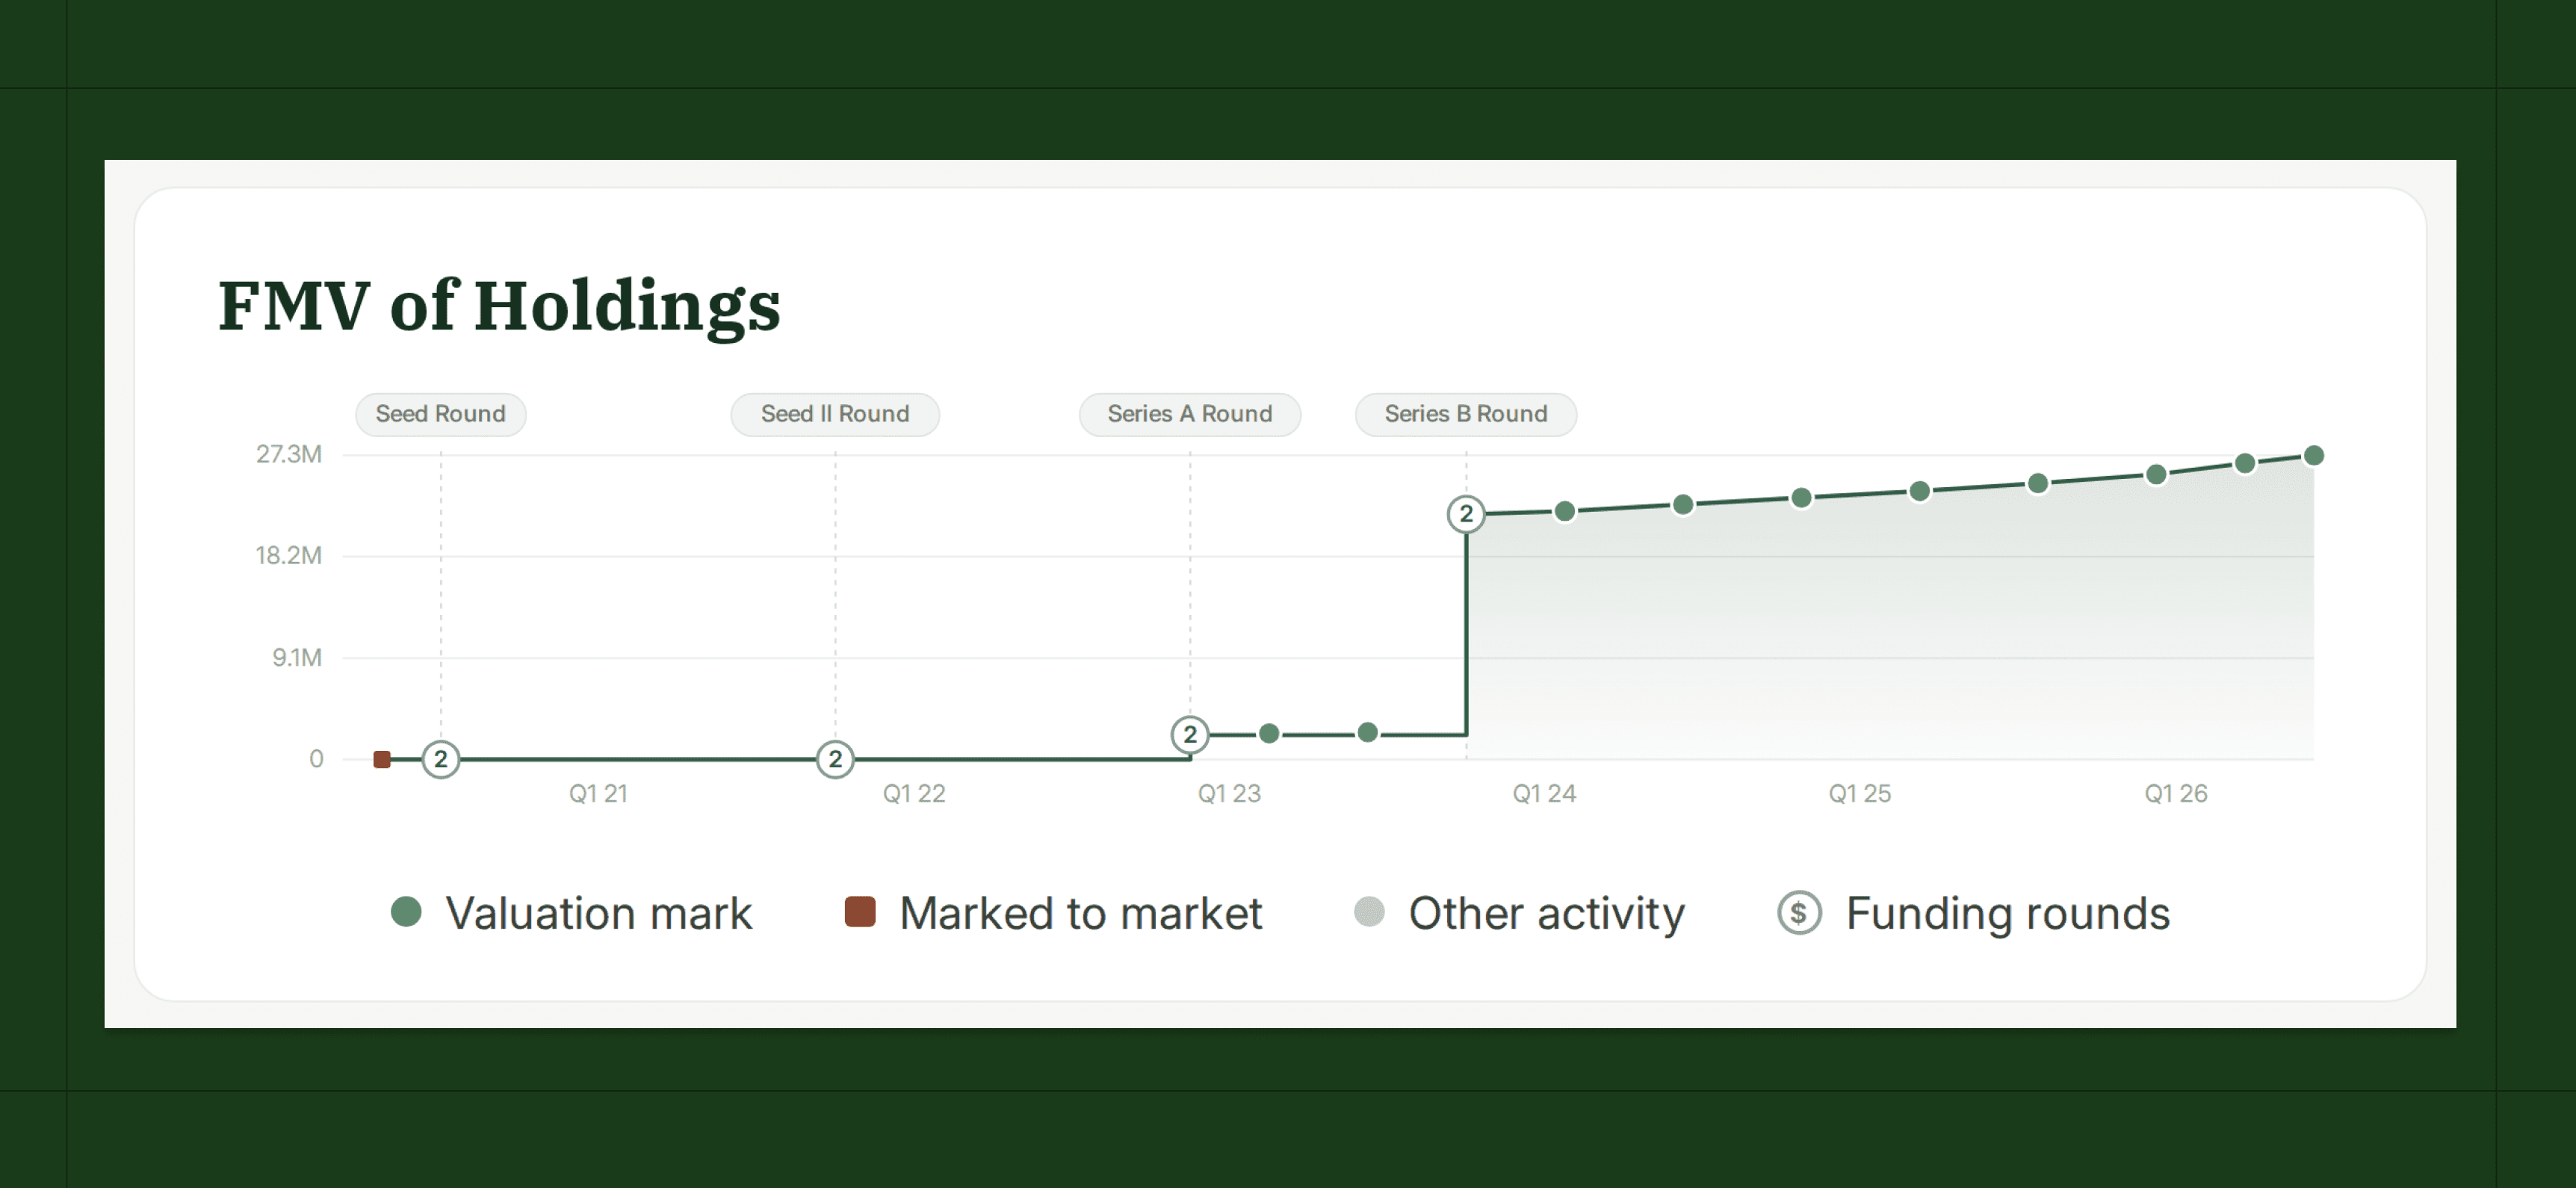
The Valuations tab now has a new trend chart at the top that plots your holdings’ value over time, with every event color-coded.
Events fall into three categories:
Valuation marks: Explicit marks, the most significant events.
Marked to market: Auto-generated marks triggered when a security transacts at a price different from the existing one.
Other activity: Events that don't change FMV/share but do affect total holdings FMV (e.g. a sale at the existing price, or a conversion).
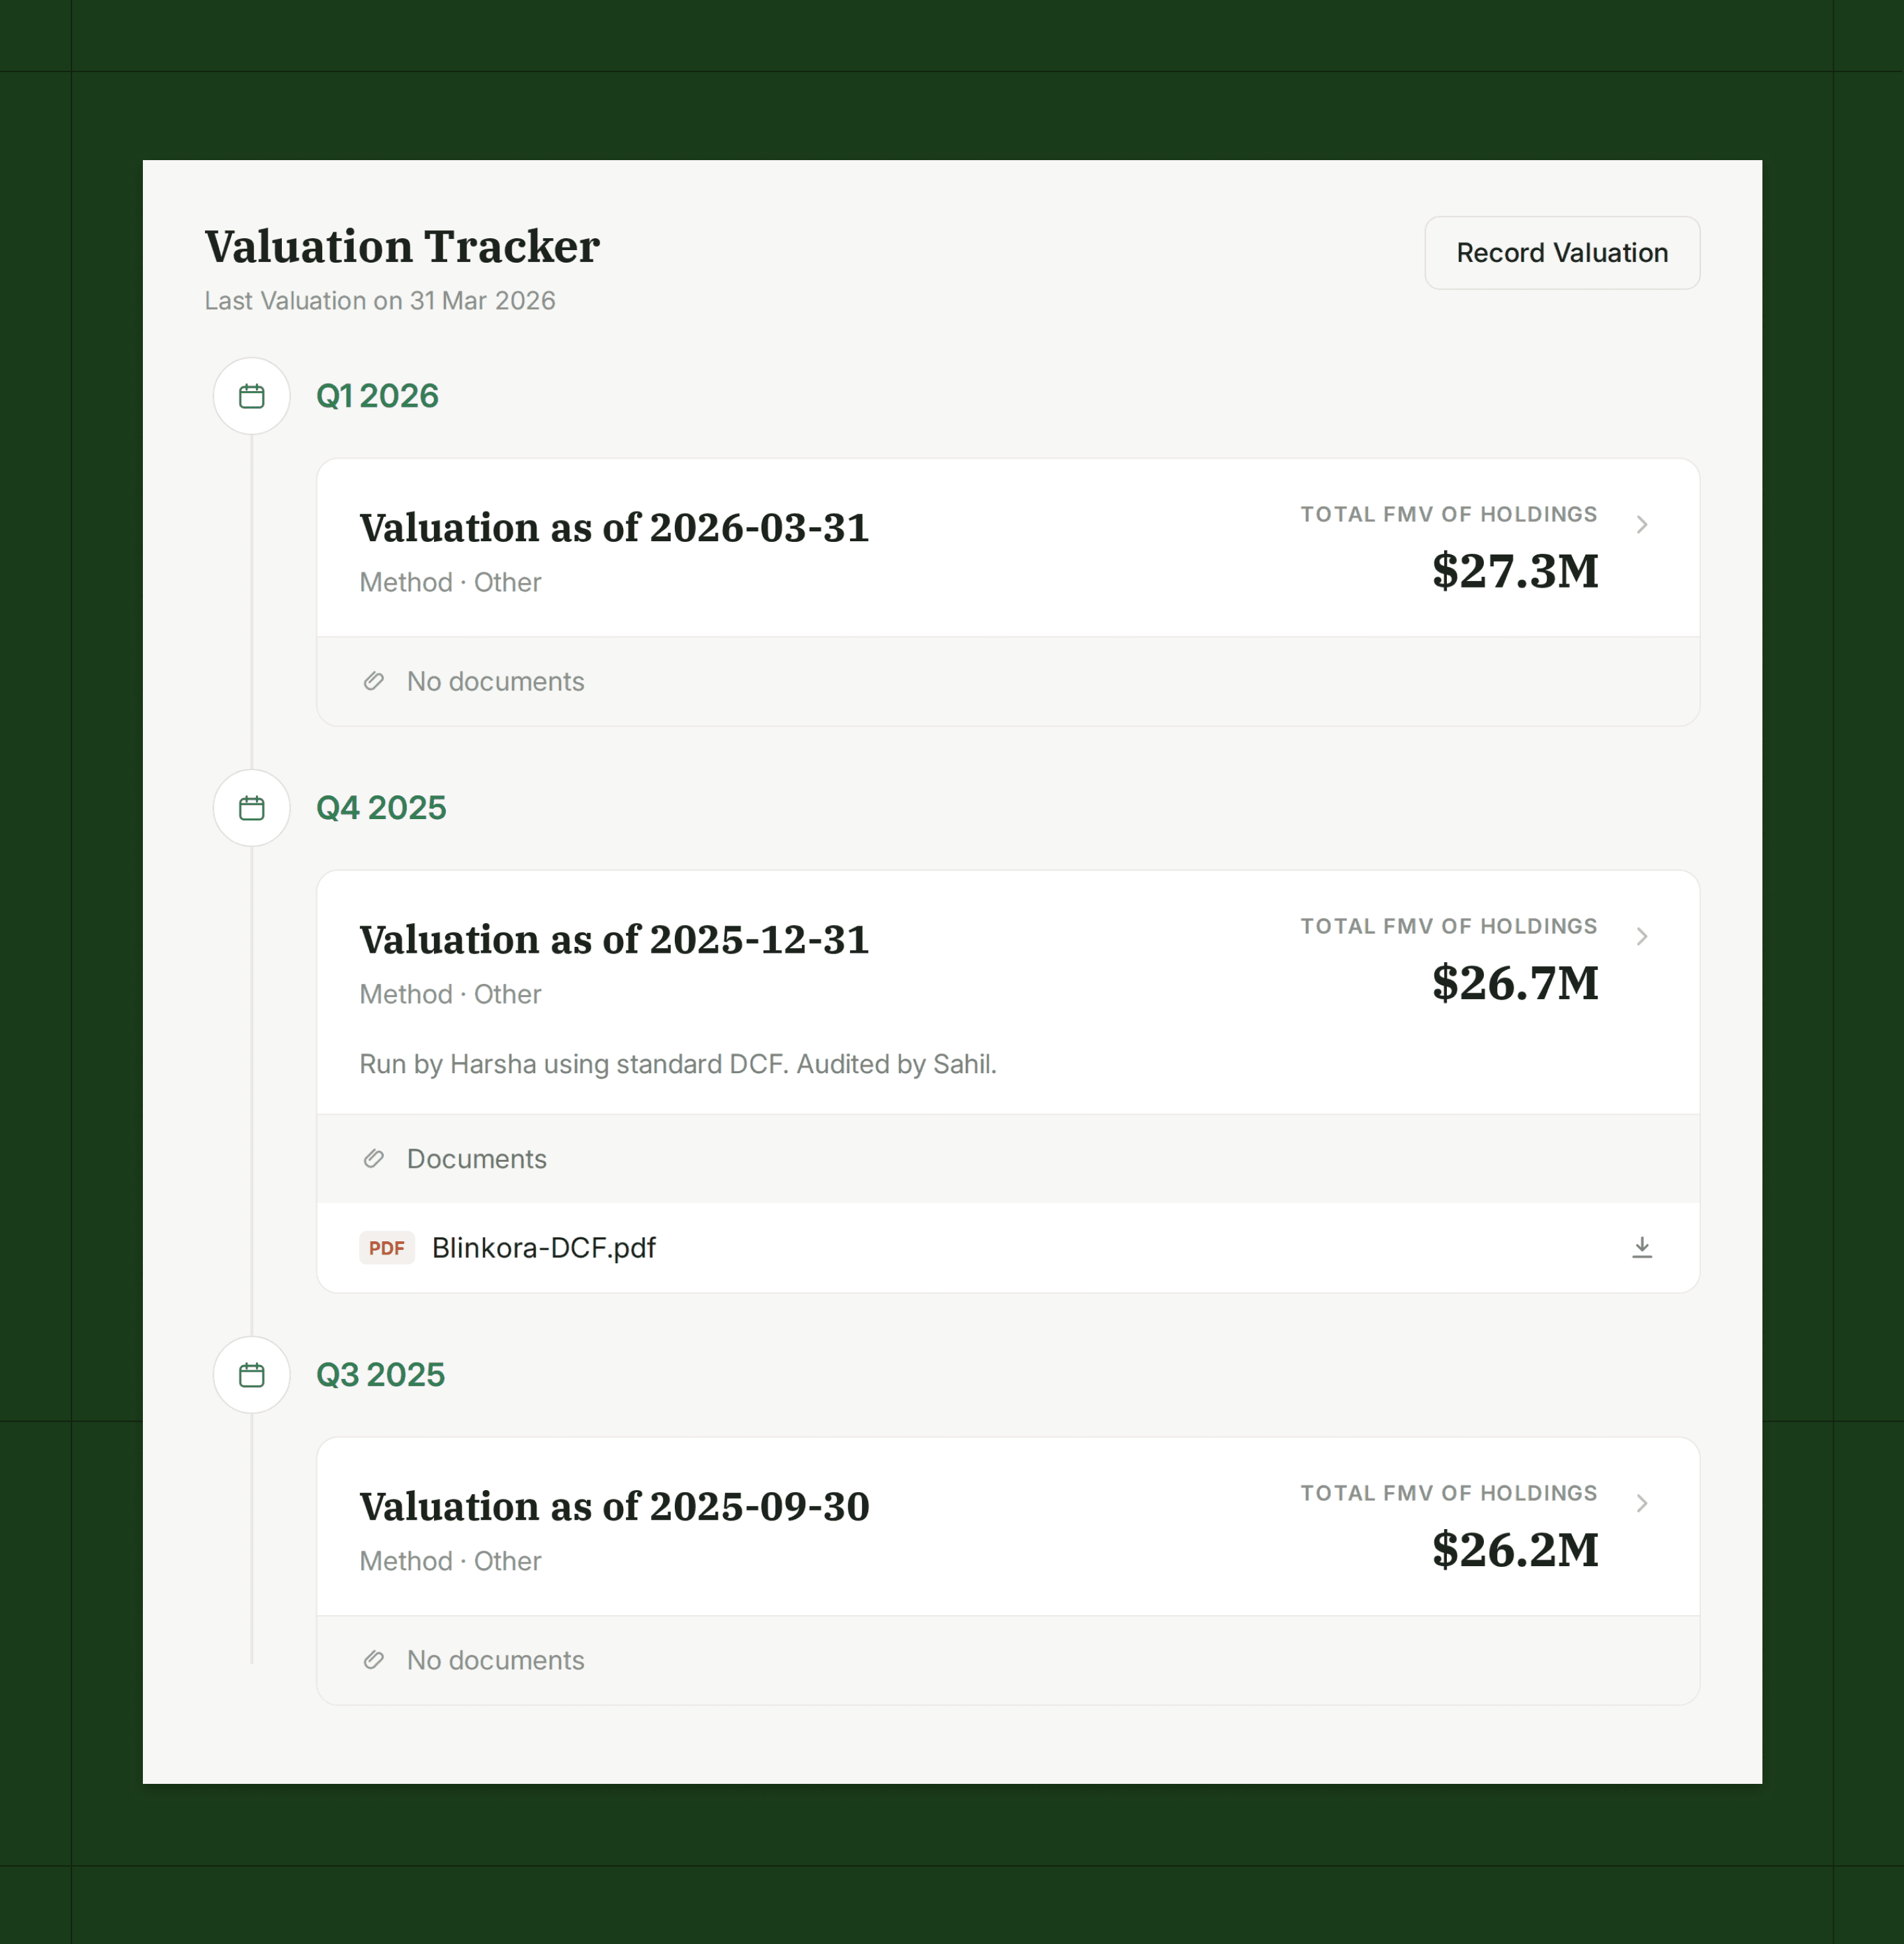
Hover any point to see what happened and jump to the record. Funding rounds are overlaid so you can compare against what the company last raised at. Plus, supporting valuation documents are now surfaced directly on each mark.