Average Selling Price
Efficiency
Industry:
Sector Agnostic
Short Definition
Average Selling Price (ASP) measures the average price a company receives per unit of product or service sold during a specific period. It helps quantify pricing power, market positioning, and revenue mix shifts — answering the question: “How much does the company actually earn per sale, on average?”
Why it matters for Investors
Pricing power indicator: A rising ASP suggests the company can charge more — due to product differentiation, brand strength, or reduced price sensitivity.
Revenue quality lens: Growth in revenue driven by ASP (vs. volume) implies higher margins and better unit economics.
Product mix signal: Shifts in ASP reveal whether sales are moving toward premium or lower-tier offerings.
Competitive benchmark: Helps investors compare unit pricing trends across peers or sectors.
Valuation input: Stable or increasing ASP supports stronger growth narratives and pricing multiple justifications.
Formula
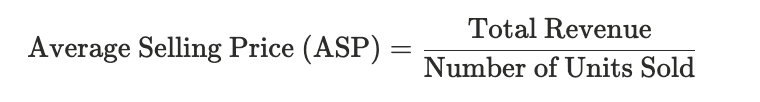
(Where “Units Sold” = physical units, licenses, users, or transactions, depending on business model)
Practical considerations:
Unit definition: For SaaS, “unit” may mean per seat or per subscription; for e-commerce, it’s per item sold; for marketplaces, it may be per transaction.
Revenue scope: Use net revenue (after discounts, returns, and taxes).
Mix shifts: A blended ASP can rise even if some product prices fall — when premium items form a larger share of total sales.
Discount impact: Promotional pricing can temporarily lower ASP — important context for investor commentary.
Formula
(Where “Units Sold” = physical units, licenses, users, or transactions, depending on business model)
Practical considerations:
Unit definition: For SaaS, “unit” may mean per seat or per subscription; for e-commerce, it’s per item sold; for marketplaces, it may be per transaction.
Revenue scope: Use net revenue (after discounts, returns, and taxes).
Mix shifts: A blended ASP can rise even if some product prices fall — when premium items form a larger share of total sales.
Discount impact: Promotional pricing can temporarily lower ASP — important context for investor commentary.
Worked Example
Product | Units Sold | Revenue | ASP |
|---|---|---|---|
Basic Plan | 400 | $80,000 | $200 |
Pro Plan | 100 | $50,000 | $500 |
Enterprise | 20 | $40,000 | $2,000 |
Totals | 520 | $170,000 | ≈$327 |
ASP = 170,000 ÷ 520 = $327 per unit (blended)
Notes:
The rise in Pro and Enterprise share can increase ASP even if Basic pricing stays flat.
Use blended ASP for total company reporting and segment ASPs for deeper analysis.
Best Practices
Segment by product: Track ASP by tier, geography, or channel to spot pricing pressure early.
Adjust for discounts: Separate one-time promotions from structural price changes.
Benchmark with peers: Compare ASP trends across competitors to gauge pricing power.
Analyze ASP vs. volume: ASP up + volume down may mean strategic upmarket shift; ASP down + volume up may signal discount-led growth.
Investor tip: Consistent ASP growth with steady or improving volume is a strong indicator of product-market fit and pricing strength.
FAQs
Is ASP the same as revenue per customer?
Not always. ASP focuses on per unit sold, while revenue per customer may include multiple units or recurring payments.Can ASP decrease even when revenue grows?
Yes. Revenue can grow due to higher sales volume even if prices fall — common in scaling or competitive markets.Does ASP include taxes or shipping?
No. ASP should exclude taxes, shipping fees, or pass-through costs — only include what the company actually earns.What affects ASP the most?
Product mix, discounting strategy, new pricing tiers, and competitive pressure are the biggest drivers.Should startups track ASP if they’re subscription-based?
Yes — it’s equivalent to Average Revenue per Account (ARPA) or Average Revenue per User (ARPU) for SaaS businesses.Is ASP the same as Average Order Value (AOV)?
ASP is per-unit pricing — helps track pricing power, product mix, and market positioning. Average Order Value (AOV) is per-transaction behavior — shows how much customers spend each time they buy.
Related Metrics
Commonly mistaken for:
ARPU (if measured per customer, not per sale)
Revenue per Transaction (short-term or cohort-based)
Average Order Value (AOV — broader, includes multi-item orders)
Related Metrics
Commonly mistaken for:
ARPU (if measured per customer, not per sale)
Revenue per Transaction (short-term or cohort-based)
Average Order Value (AOV — broader, includes multi-item orders)
Related Metrics
Commonly mistaken for:
ARPU (if measured per customer, not per sale)
Revenue per Transaction (short-term or cohort-based)
Average Order Value (AOV — broader, includes multi-item orders)
Components:
Index