Net Interest Margin %
Efficiency
Financials
Industry:
Fintech
Short Definition
Net Interest Margin % (NIM%) measures how efficiently a lending or fintech platform earns interest income from its assets relative to the cost of funding them. It shows the profitability of lending activities — the percentage “spread” your company keeps after paying for deposits, debt, or partner bank costs. In simple terms: How much return does each dollar of loans or interest-earning assets generate?
Why it matters for Investors
Core profitability check: NIM reveals how well a startup’s lending business converts capital into earnings.
Pricing power signal: High NIM means the company can charge healthy loan rates or manage cheaper funding — both signs of strong product–market fit and risk control.
Funding strategy indicator: Low or falling NIM often signals funding strain — costly debt, competitive deposit rates, or poor pricing discipline.
Investor confidence driver: Consistent NIM proves the lending model can scale sustainably and resist margin compression in different rate environments.
Comparable metric: Enables benchmarking across neobanks, credit platforms, or digital lenders, regardless of their asset size.
Formula
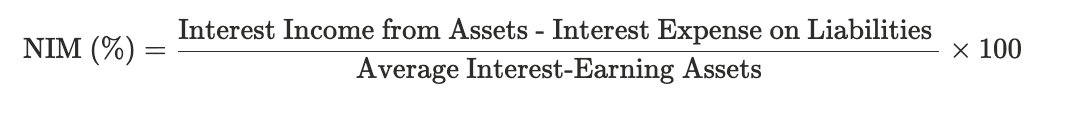
Practical considerations:
Assets: These are the interest-earning parts of your balance sheet — things that generate income. For fintechs or lending startups, this usually means loans, credit lines, or short-term investments (like treasury bills). Think: “Where my money is working and earning.”
Liabilities: These are the interest-bearing obligations — the money you owe that costs you interest to use. For example: customer deposits, credit facilities, bank borrowings, or investor debt. Think: “Where my money comes from and what I pay for it.”
Interest income and expense: Use the same definitions as for Net Interest Income — interest earned on lending minus interest paid for funding.
Time period: Always calculate over an average of the period’s beginning and ending balances to smooth out short-term spikes.
Business model fit: Relevant for fintechs, neobanks, and credit platforms — not for SaaS or fee-only startups.
Rate sensitivity: In rising rate environments, asset yields and funding costs move differently — tracking NIM helps you see who benefits and who gets squeezed.
Stability goal: Stable or improving NIM signals strong balance-sheet management and risk pricing discipline.
Formula
Practical considerations:
Assets: These are the interest-earning parts of your balance sheet — things that generate income. For fintechs or lending startups, this usually means loans, credit lines, or short-term investments (like treasury bills). Think: “Where my money is working and earning.”
Liabilities: These are the interest-bearing obligations — the money you owe that costs you interest to use. For example: customer deposits, credit facilities, bank borrowings, or investor debt. Think: “Where my money comes from and what I pay for it.”
Interest income and expense: Use the same definitions as for Net Interest Income — interest earned on lending minus interest paid for funding.
Time period: Always calculate over an average of the period’s beginning and ending balances to smooth out short-term spikes.
Business model fit: Relevant for fintechs, neobanks, and credit platforms — not for SaaS or fee-only startups.
Rate sensitivity: In rising rate environments, asset yields and funding costs move differently — tracking NIM helps you see who benefits and who gets squeezed.
Stability goal: Stable or improving NIM signals strong balance-sheet management and risk pricing discipline.
Worked Example
Metric | Value | Notes |
|---|---|---|
Interest Income | $1,200,000 | Earned from loans and credit products |
Interest Expense | $400,000 | Cost of debt, deposits, or funding |
Average Interest-Earning Assets | $20,000,000 | Total average loan book or equivalent |
Net Interest Income (NII) | $800,000 | 1,200,000 − 400,000 |
Net Interest Margin (%) | 4.0% | (0.8M ÷ 20M) × 100 |
Notes:
Interpretation: A 4% NIM means the company earns 4 cents in interest profit for every $1 it has lent or invested.
Good range: Early-stage lenders often target 3–7% NIM depending on product mix and funding cost.
Trend focus: Rising NIM = improving pricing or cheaper capital; falling NIM = pressure from competition or higher debt cost.
Investor signal: A stable NIM during growth shows the company can scale its balance sheet without losing profitability.
Cross-check: Ensure NIM aligns with total revenue composition — if fee income dominates, NIM will understate overall margin health.
Best Practices
Track over time: Plot NIM monthly or quarterly to spot funding cost creep early.
Compare peers: Benchmark against similar fintechs — deposit-funded models often have lower NIM than loan-originating platforms.
Link with loss rates: Pair NIM with credit loss ratios to see true “risk-adjusted yield.” Risk-Adjusted Yield means how much return a company earns after accounting for the risk of losing money — usually due to defaults or credit losses. For a fintech or lender, it refines the raw yield (interest rate earned) by subtracting expected credit losses or default costs. It tells investors not just “how much you charge” but “how much you actually keep after borrowers who don’t pay.” Don’t just look at the margin (spread) — also see how much of that spread survives after credit risk.
Model interest scenarios: Simulate how +1% or −1% rate changes impact NIM; this helps investors see rate sensitivity. Because Net Interest Margin (NIM) depends directly on interest rates — both what you earn on your loans and what you pay for funding. Even small shifts in market rates (say 1%) can significantly affect your profitability. By simulating “what happens if rates rise or fall”, founders and investors can understand how sensitive the business model is to those changes.
Rate sensitivity = risk profile. Investors want to know whether your earnings depend heavily on external interest rate movements.
Shows pricing power. A startup that can quickly adjust loan rates upward (to protect NIM) has a more resilient model.
Improves forecasting. Scenario testing helps predict future profitability under different economic environments.
Focus on sustainability: Expanding NIM through better pricing or lower risk is healthy; boosting it by taking riskier loans isn’t.
FAQs
Why is NIM important for fintechs and neobanks?
It shows how efficiently the company turns its loan book or deposits into profit — the foundation of all spread-based business models.Is higher NIM always better?
Not always. Very high NIM can mean taking on higher-risk customers or using expensive capital. Balance yield with risk and credit quality.Can NIM fall even if revenue grows?
Yes. If funding costs rise faster than interest income, total revenue can grow but margins still tighten.How is NIM different from NII?
NII is the total dollar amount of interest profit. NIM expresses that same profit as a percentage of the assets generating it — letting investors compare efficiency across companies.How do interest rate changes affect NIM?
When rates rise, lenders with flexible pricing often see higher NIM. Deposit-heavy fintechs may see NIM fall if they must pay customers more interest.
Related Metrics
Commonly mistaken for:
Net Interest Income (A dollar figure, not a percentage)
Gross Profit (includes non-interest income)
Interest Spread (absolute difference, not ratio)
Related Metrics
Commonly mistaken for:
Net Interest Income (A dollar figure, not a percentage)
Gross Profit (includes non-interest income)
Interest Spread (absolute difference, not ratio)
Components:
Index