Pipeline Coverage Ratio
Efficiency
Industry:
Sector Agnostic
Short Definition
Pipeline Coverage Ratio measures how much potential revenue currently exists in the sales pipeline compared with the sales target for a given period (usually a quarter). It shows whether the pipeline is large enough to realistically hit revenue goals based on typical win rates and deal cycles.
In plain terms — it tells you if there are enough qualified deals in progress to meet your sales quota or forecast.
Why it matters for Investors
Forecast confidence: Investors use Pipeline Coverage to see whether near‑term revenue targets are achievable. A coverage ratio below 1× usually means the team can’t hit their goal unless win rates spike.
Health of go‑to‑market engine: Strong coverage ratios (typically 3×–5×) show robust demand generation and sales momentum.
Early warning indicator: Declining coverage can flag slowing pipeline creation — a concern for growth planning and runway visibility.
Efficiency insight: When paired with Win Rate (%), it highlights whether the company needs more leads or simply better conversion to achieve targets.
Scaling readiness: Growing coverage over successive quarters signals a scalable sales process and balanced top‑of‑funnel health.
Formula
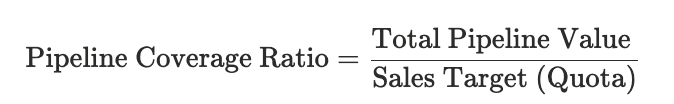
The numerator (“Total Pipeline Value”) in Pipeline Coverage Ratio is typically based on total Pipeline ACV (Annual Contract Value) or total of all TCVs (Total Contract Value), depending on how your sales pipeline is denominated.
Practical considerations:
Define “pipeline value” consistently — usually the total value of open opportunities expected to close in the measured period (weighted or unweighted).
Match time periods: Both pipeline and target must refer to the same window (e.g., Q2 pipeline vs. Q2 quota).
Weighting approach: Some teams use weighted pipeline (deal value × probability of close) for better realism.
Avoid double counting: Only include active, open deals — remove renewals already certain to close or outdated opportunities.
Formula
The numerator (“Total Pipeline Value”) in Pipeline Coverage Ratio is typically based on total Pipeline ACV (Annual Contract Value) or total of all TCVs (Total Contract Value), depending on how your sales pipeline is denominated.
Practical considerations:
Define “pipeline value” consistently — usually the total value of open opportunities expected to close in the measured period (weighted or unweighted).
Match time periods: Both pipeline and target must refer to the same window (e.g., Q2 pipeline vs. Q2 quota).
Weighting approach: Some teams use weighted pipeline (deal value × probability of close) for better realism.
Avoid double counting: Only include active, open deals — remove renewals already certain to close or outdated opportunities.
Worked Example
Line Item | Value | Notes |
|---|---|---|
Total Open Pipeline for Q2 | $1,000,000 | Total value of all qualified deals scheduled to close this quarter |
Quarterly Sales Target | $300,000 | Revenue goal for Q2 |
Pipeline Coverage Ratio | ($1,000,000 ÷ $300,000) = 3.33× | Pipeline is 3.3× the target |
Notes:
The team has 3.33× pipeline coverage, meaning they have $3.33 in potential deals for every $1 of sales target.
If their Win Rate is 30%, expected bookings ≈ $1,000,000 × 0.3 = $300,000 — right on target.
If coverage fell to 2× next quarter with the same win rate, expected bookings would drop below quota — an early red flag.
Best Practices
Automate in CRM dashboards: Keep a real‑time view of coverage by team, region, or product line.
Review monthly but plan quarterly: It smooths short‑term volatility while tracking build‑up toward quarterly goals.
Track weighted and unweighted: Weighted coverage gives realistic forecasts; unweighted shows raw pipeline build‑up.
Link with Win Rate (%): Together they determine actual revenue predictability.
FAQs
How does Pipeline Coverage differ from Win Rate?
Pipeline Coverage shows input strength (deal volume/value), while Win Rate shows conversion effectiveness. Both together forecast sales performance.What happens if the ratio falls too low?
Low coverage means even if your team performs perfectly, you simply don’t have enough deals to make the number. It’s an early warning to: Boost lead generation, Qualify more opportunities, or Prioritize high‑value deals already in play.Can coverage be too high?
Yes — 8× or 10× coverage may sound great, but often means your pipeline is full of unqualified or stale deals. Quality beats quantity; realistic, actively managed deals tell a better story to investors than inflated pipelines.How does this connect to Win Rate (%)?
They work together: Win Rate shows how often you close deals. Pipeline Coverage shows whether there’s enough pipeline to feed that win rate and hit goals. Example: If your Win Rate is 25%, you need roughly 4× coverage to meet your target.
Related Metrics
Commonly mistaken for:
Win Rate (%) (Win Rate measures how efficiently deals close; Coverage shows if there’s enough pipeline to hit the target)
Sales Target Attainment (%) (Attainment looks backward at results achieved; Coverage looks forward at readiness to hit the goal)
Forecast Accuracy (Checks how close forecasts are to actuals; Coverage focuses on pipeline sufficiency, not prediction accuracy)
Components:
Index