Pipeline - Win Rate %
Growth
Efficiency
Industry:
Sector Agnostic
Short Definition
Pipeline - Win Rate (%) is a key sales metric that measures the percentage of closed sales opportunities or quotes that result in a successful deal (closed-won). It reflects a team’s effectiveness at converting proposals or quotes into actual sales, providing insight into sales process efficiency.
Why it matters for Investors
Shows sales effectiveness: Win Rate tells you how often a company’s sales team actually converts real opportunities into paying customers. A strong rate means the team is selling well and customers genuinely want the product.
Helps judge growth predictability: If a startup consistently wins a similar share of its pipeline, forecasts become much more reliable — revenue becomes easier to model and less of a guess.
Reveals product‑market fit: High win rates often mean customers clearly understand the value and see fewer reasons to choose competitors. Low win rates can signal unclear value propositions or tough competition.
Connects to efficiency and burn: When win rates are high, every marketing and sales dollar works harder — the company needs fewer leads to hit targets, conserving cash and improving runway.
Tracks scalability: As startups grow, maintaining or improving win rates shows that processes and messaging scale effectively, not just sales headcount.
Formula
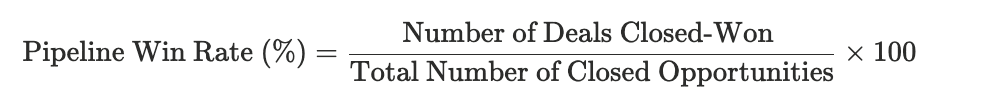
Practical considerations:
Define “qualified”: Make sure everyone uses the same rule for when a deal officially enters the pipeline (e.g., when it becomes a Sales Qualified Lead).
Segment for insight: Track win rate by inbound vs. outbound, product line, or customer size — each segment behaves differently.
Match by period: Only compare deals created in the same time frame to see true performance trends.
Clean your pipeline: Remove outdated opportunities — a bloated pipeline gives false win‑rate confidence.
Formula
Practical considerations:
Define “qualified”: Make sure everyone uses the same rule for when a deal officially enters the pipeline (e.g., when it becomes a Sales Qualified Lead).
Segment for insight: Track win rate by inbound vs. outbound, product line, or customer size — each segment behaves differently.
Match by period: Only compare deals created in the same time frame to see true performance trends.
Clean your pipeline: Remove outdated opportunities — a bloated pipeline gives false win‑rate confidence.
Worked Example
Line Item | Value | Notes |
|---|---|---|
Qualified Deals This Quarter | 120 | Deals that reached the “Qualified” stage |
Closed-Won Deals | 30 | Completed sales from the same group |
Pipeline Win Rate (%) | (30 ÷ 120) × 100 = 25% | Share of qualified deals successfully converted to closed-won |
Notes:
The company turned 25% of qualified opportunities into customers.
If the qualified pipeline value was $6M and $1.5M converted, revenue‑based win rate would also be 25%.
This indicates roughly 1 in 4 real sales opportunities becomes a customer.
Tracking this quarter over quarter shows whether the go‑to‑market motion is becoming more efficient or needs refinement.
Best Practices
Set stage definitions early: Agree on what qualifies as a valid opportunity and what counts as “Closed–Won” or “Closed–Lost.” Clear definitions make your win‑rate data real, not inflated.
Analyze losses, not just wins: Break down why deals are lost (price, features, timing, champion change, etc.). Regular loss‑reason reviews improve sales messaging and product feedback loops.
Look at trends, not single periods: Win rate can swing wildly month to month — track it over rolling quarters to see true performance direction.
Calculate both count and value win rates: Count‑based tells you team efficiency; value‑based shows if the biggest deals are converting. They can move in opposite directions, revealing hidden pipeline risks.
Benchmark by deal size and segment: Win rate for SMB deals won’t match enterprise — separating them avoids misleading averages.
Adjust for deal cycle length: A low monthly win rate may just mean deals are mid‑cycle. Align your measurement window with average sales duration.
FAQs
What’s the difference between Pipeline Win Rate and overall Conversion Rate?
Win Rate focuses only on qualified sales opportunities. Conversion Rate may include earlier stages like leads or MQLs, so they measure different funnel points.Should I calculate win rate by count or by value?
Both — deal count shows sales success rates, while value‑based win rate shows revenue yield, which investors often prefer for forecasting.Why can the metric change sharply between periods?
Pipeline timing, deal slippage, or one large account win/loss can swing the percentage. That’s normal for early‑stage companies with small sample sizes.Does a higher win rate always mean better performance?
Not always; a super‑high win rate with a shrinking pipeline can mean your team is too conservative in what they chase. Balance win rate with pipeline growth and coverage.
Related Metrics
Commonly mistaken for:
Lead Conversion Rate (Measures lead → opportunity conversion, not qualified deal → win rate)
Quote-to-Close Ratio (Tracks proposals closed, typically a later funnel stage)
Related Metrics
Commonly mistaken for:
Lead Conversion Rate (Measures lead → opportunity conversion, not qualified deal → win rate)
Quote-to-Close Ratio (Tracks proposals closed, typically a later funnel stage)
Components:
Index