Repurchase Rate %
Usage
Efficiency
Industry:
Sector Agnostic
Short Definition
Repurchase Rate (also known as Repeat Purchase Rate) measures the ability of a platform or brand to retain its customers over time. It identifies the percentage of your customer base that has made at least one additional purchase after their initial transaction. In the eCommerce and marketplace world, this is crucial for determining Product-Market Fit (PMF) and long-term sustainability
Why it matters for Investors
The "Second Purchase" Hurdle: For many startups, the first purchase is "bought" via marketing (CAC). The second purchase is "earned" via product value. High repurchase rates prove that the product actually solves a problem.
LTV Predictor: Repurchase rate is the primary driver of Customer Lifetime Value (LTV). A high rate suggests a high "ceiling" for how much a customer is worth, allowing the company to spend more on acquisition (CAC) confidently.
Marketing Efficiency: It costs significantly less to retain an existing customer than to acquire a new one. A high repeat rate indicates a healthy CAC:LTV ratio and organic growth potential.
Cohort Health: Investors look for "stabilizing" repeat rates across cohorts. If newer cohorts have higher repurchase rates than older ones, it signals that the product and user experience are improving over time.
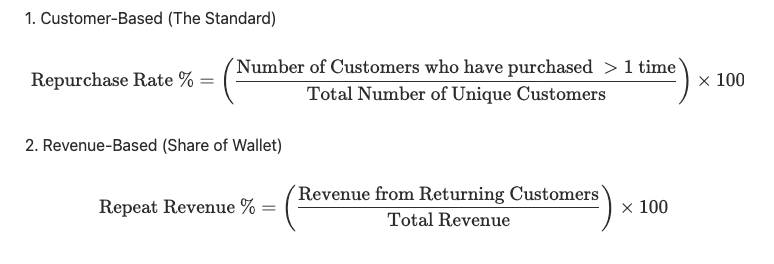
Formula
There are two primary ways to calculate this, and you should track both:
Practical considerations:
Time Windows: Repurchase rate is meaningless without a timeframe (e.g., 30-day, 90-day, or 12-month repeat rate). Define your window based on your product’s natural consumption cycle (e.g., coffee is daily/weekly; furniture is multi-year).
New vs. Returning Mix: A very high repeat revenue % might actually signal a stagnant business that isn't acquiring enough new users. Investors look for a healthy balance.
Discount Sensitivity: Be careful of "Incentivized Repurchases." If your repeat rate is high only because you are sending constant 50% off coupons, your unit economics (Contribution Margin) will suffer.
Cohort vs. Aggregate: Aggregate repeat rates can be misleading if you are growing fast. Always look at Cohort Repurchase Rates to see how a specific group of people behaves over their first 6–12 months.
Worked Example
Metric | Value | Notes |
|---|---|---|
Total Customers (YTD) | 10,000 | Unique individuals who made at least one purchase this year |
First-Time Buyers | 7,000 | Customers completing their first-ever transaction |
Repeat Buyers | 3,000 | Customers on their 2nd, 3rd, or subsequent transactions |
Customer-based Repurchase Rate (%) | 30% | 3,000 ÷ 10,000 |
Total Revenue | $1,000,000 | |
Revenue from Repeat Buyers | $450,000 | Repeat buyers often have higher AOV |
Revenue-based Repurchase Rate (%) | 45% | Repeat buyers are 30% of users but 45% of revenue |
Notes:
The "Magic" Number: In eCommerce, the jump from the 1st to the 2nd purchase is the hardest. Once a customer makes a 3rd purchase, the probability of them making a 4th or 5th usually skyrockets (often to 70%+).
Selection Bias: Your best customers will always have the highest repeat rates. The goal is to move the "middle" of your customer base toward that second purchase.
AOV Correlation: Often, repeat customers have a higher Average Order Value (AOV) than first-time buyers because they trust the brand and are willing to buy more at once.
Best Practices
Track "Time to Second Purchase": Measure the average number of days between the 1st and 2nd order. If you can shrink this window, you accelerate your cash flow.
Segment by Category: Some categories naturally have higher repeat rates (e.g., groceries) than others (e.g., electronics). Compare categories to see where to focus your retention efforts.
NPS Correlation: Map your Net Promoter Score (NPS) against repurchase rates. If people say they love you (high NPS) but don't come back (low repeat rate), you have a "utility" problem, not a "brand" problem.
FAQs
What is a "good" repurchase rate?
It is highly industry-dependent. For fashion/apparel, 20–30% is standard. For high-frequency consumables (CPG/Grocery), you want 50%+. For luxury goods, 10–15% may be acceptable.Is Repurchase Rate the same as Retention Rate?
Not exactly. Retention usually refers to a user remaining "active" (logging in, browsing). Repurchase Rate is specifically tied to a financial transaction.How to improve it?
Post-purchase flows, loyalty programs, personalized recommendations, and subscription models (e.g., "Subscribe & Save") are the most common levers.
Related Metrics
Commonly mistaken for:
Purchase Frequency ((Repurchase Rate tells you how many customers came back; Purchase Frequency tells you how often they come back. A company could have a high repurchase rate (everyone comes back once) but low purchase frequency (no one comes back a third time)
Components:
Index