Annual Contract Value
Growth
Industry:
E-Commerce, Marketplaces, Fintech
Aliases:
Short Definition
Annual Contract Value (ACV) represents the annualized value of a customer’s contracted recurring revenue, derived from the Total Contract Value (TCV) and normalized by the contract term. It standardizes deals of varying lengths into a per-year figure, providing a consistent measure of revenue scale per customer or account.
By converting multi-year agreements into an annual baseline, ACV helps compare customer commitments, assess enterprise traction, and anchor recurring revenue forecasts.
Why it matters for Investors
Revenue quality signal: High or growing ACV suggests customer willingness to commit larger budgets - a sign of strong value delivery and enterprise traction.
Sales productivity metric: Tracking ACV helps investors and founders understand if the go-to-market team is moving “upmarket” or adding higher-value customers.
Forecasting anchor: ACV feeds directly into Annual Recurring Revenue (ARR) modeling and helps forecast growth efficiency (e.g., ARR growth per sales rep or per dollar of CAC).
Churn sensitivity: Since churn often occurs on a per-contract basis, ACV provides a clean lens to model recurring revenue stability.
Formula
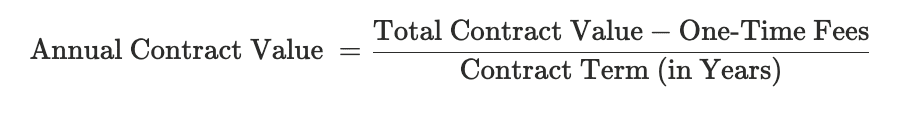
Practical considerations:
Revenue scope: ACV focuses on contractual recurring revenue, excluding one-time setup fees, usage-based charges, or variable components not guaranteed by contract.
Include: Recurring subscription or service fees that are contractually committed.
Exclude: Implementation fees, onboarding, hardware purchases, or usage overages not guaranteed by contract.
Annualize multi-year deals: A 3-year $300K deal has an ACV of $100K.
Normalize partial-year terms: Month-to-month or 6-month contracts can be annualized for comparison (e.g., $5K for 6 months → $10K ACV).
Segmentation: Track by customer segment (SMB, mid-market, enterprise) to reveal pricing power and contract strategy.
Reconciliation: Check aggregate ACV across customers against total ARR - ACV × number of active contracts should approximate ARR when churn and expansion are stable.
Formula
Practical considerations:
Revenue scope: ACV focuses on contractual recurring revenue, excluding one-time setup fees, usage-based charges, or variable components not guaranteed by contract.
Include: Recurring subscription or service fees that are contractually committed.
Exclude: Implementation fees, onboarding, hardware purchases, or usage overages not guaranteed by contract.
Annualize multi-year deals: A 3-year $300K deal has an ACV of $100K.
Normalize partial-year terms: Month-to-month or 6-month contracts can be annualized for comparison (e.g., $5K for 6 months → $10K ACV).
Segmentation: Track by customer segment (SMB, mid-market, enterprise) to reveal pricing power and contract strategy.
Reconciliation: Check aggregate ACV across customers against total ARR - ACV × number of active contracts should approximate ARR when churn and expansion are stable.
Worked Example
Contract | Deal Value | Term (Years) | ACV | Notes |
|---|---|---|---|---|
A | $60,000 | 1 | $60,000 | 1-year subscription |
B | $300,000 | 3 | $100,000 | 3-year enterprise contract |
C | $15,000 | 0.5 | $30,000 | 6-month deal, annualized |
Total / Average | - | - | $63,333 | ($60K + $100K + $30K) / 3 = $63,333 |
Here, Average ACV = $63.3K, showing the typical annual contractual value per customer.
Notes:
Contract A ($60K ACV) reflects a typical annual subscription — fully recognized each year, simple 1:1 correspondence between contract value and annual revenue.
Contract B ($100K ACV) shows how a larger, multi-year enterprise deal is standardized. While the total commitment is $300K over 3 years, ACV converts it into $100K per year for comparability across contracts.
Contract C ($30K ACV) demonstrates annualization of short-term contracts. The 6‑month deal is effectively doubled to express its annualized rate, making it comparable with full-year agreements.
Average ACV ($63.3K) indicates the typical annual contractual revenue per customer, useful for modeling go-to-market efficiency (e.g., ACV-to-CAC ratios or sales productivity).
Portfolio implication: If average ACV is rising over time, it may signal successful upmarket movement, improved pricing power, or deeper product adoption among larger customers.
Best Practices
Align with ARR: Ensure your ACV definition matches what’s counted as recurring in ARR.
Track trends by cohort: Monitor how ACV evolves by deal vintage (new vs. renewal) to gauge pricing leverage and upsell effectiveness.
Correlate with CAC: Comparing Customer Acquisition Cost (CAC) to ACV helps evaluate payback periods and go-to-market efficiency.
Use for segmentation: Differentiate performance metrics for enterprise vs. SMB channels.
Automate reporting: Use CRM data to generate cohort-level ACV metrics automatically, keeping it updated with contract amendments or renewals.
FAQs
Does ACV include one-time setup or implementation fees?
No, ACV reflects recurring contract value only. One-time fees are non-recurring revenue.How is ACV different from ARR?
ARR sums all active annualized contract values at a point in time, it’s a cumulative measure.
ACV focuses on the per-contract annualized value.Can usage-based contracts have ACV? Only if there’s a guaranteed minimum. Otherwise, report them separately as variable or consumption-based contracts.
Why do investors look at ACV?
Because it shows deal quality and contract scale. Increasing ACV often signals stronger market fit, pricing power, or enterprise success.What’s the difference between TCV and ACV?
TCV is the total contract value over its lifetime.
ACV is the annualized value. For example, a $120K two-year contract has a TCV of $120K and ACV of $60K.
Related Metrics
Commonly mistaken for:
ARR (Excludes non-recurring revenue)
TCV (Total contract value, not annualized)
Average Annual Contract Value (per customer) (May average across multiple contracts)
Related Metrics
Commonly mistaken for:
ARR (Excludes non-recurring revenue)
TCV (Total contract value, not annualized)
Average Annual Contract Value (per customer) (May average across multiple contracts)
Components:
Index