ARR/ FTE
Efficiency
Industry:
SaaS
Short Definition
ARR / FTE measures the annual recurring revenue generated by a company divided by its number of full-time equivalent employees (FTEs). It indicates how much recurring revenue each employee helps produce, serving as a key productivity and efficiency metric in subscription-based businesses like SaaS.
Why it matters for Investors
Operational efficiency: Demonstrates how effectively the company leverages human resources to generate recurring revenue.
Scalability signal: Higher ARR / FTE suggests better revenue generation per employee, indicating scalable operations.
Benchmarking: Enables investors to compare workforce productivity across companies or industry peers.
Cost control insight: Helps identify if growth is driven by revenue expansion or inflated headcount, informing margins and profitability.
Growth quality: Sustained improvement in ARR / FTE aligns with healthy unit economics and operational leverage.
Formula
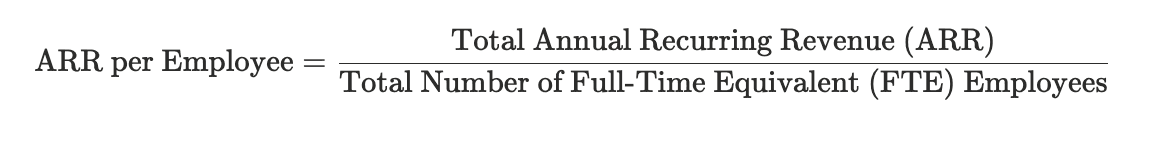
Where:
ARR = predictable revenue from subscriptions expected annually
FTE = total workforce measured in full-time equivalents (part-time converted to full-time basis)
Practical considerations:
Count FTEs consistently: include all full-time employees plus part-time equivalents.Include all FTEs, prorating part-time or contract workers based on a standard full-time workload (e.g., 40 hours/week).
Track over time to assess improvements or degradations in efficiency.
Interpret in context of company stage: early startups may have lower ARR / FTE due to upfront hiring; mature firms typically have higher metrics.
Combine with other metrics like CAC, churn rate, and gross margin for comprehensive operational analysis.
Churn Rate: The percentage of customers or revenue lost over a specified period, indicating customer retention effectiveness.
Customer Acquisition Cost (CAC): The average cost incurred to acquire a new customer.
Gross Margin: The percentage of revenue a company retains after deducting the direct costs of producing its goods or services (cost of goods sold), showing how efficiently it turns sales into gross profit before other expenses.
Policy clarity: Document how seasonal hires, contractors, or non-revenue-generating staff are handled in the calculation.
Formula
Where:
ARR = predictable revenue from subscriptions expected annually
FTE = total workforce measured in full-time equivalents (part-time converted to full-time basis)
Practical considerations:
Count FTEs consistently: include all full-time employees plus part-time equivalents.Include all FTEs, prorating part-time or contract workers based on a standard full-time workload (e.g., 40 hours/week).
Track over time to assess improvements or degradations in efficiency.
Interpret in context of company stage: early startups may have lower ARR / FTE due to upfront hiring; mature firms typically have higher metrics.
Combine with other metrics like CAC, churn rate, and gross margin for comprehensive operational analysis.
Churn Rate: The percentage of customers or revenue lost over a specified period, indicating customer retention effectiveness.
Customer Acquisition Cost (CAC): The average cost incurred to acquire a new customer.
Gross Margin: The percentage of revenue a company retains after deducting the direct costs of producing its goods or services (cost of goods sold), showing how efficiently it turns sales into gross profit before other expenses.
Policy clarity: Document how seasonal hires, contractors, or non-revenue-generating staff are handled in the calculation.
Worked Example
Line Item | Amount/Value | Notes |
|---|---|---|
Total ARR | $2,400,000 | Annualized recurring revenue |
Total FTE Employees | 50 | 45 full-time + 5 part-time (prorated) |
ARR per FTE | $48,000 | $2,400,000 / 50 |
Notes
If ARR / FTE rises over time, operational leverage is improving.
If ARR / FTE declines, company should investigate productivity or potential over-hiring.
Best Practices
Accurate headcount: Regularly review and update FTE counts to reflect current staffing.
Revenue focus: Ensure ARR excludes non-recurring revenue for consistency.
Segmentation: Analyze ARR per Employee by department or role for deeper insights.
Trend tracking: Monitor over time to assess productivity improvements.
Industry comparison: Benchmark against peers to gauge operational efficiency.
FAQs
Is ARR / FTE a profitability metric?
No, it measures revenue productivity per employee, not profits or costs.Can ARR / FTE be too high?
Extremely high values may indicate lean operations but risk employee burnout or underinvestment.Can ARR/ FTE decrease?
Yes, due to headcount growth outpacing revenue or revenue decline.How are part-time employees handled?
Prorated as a fraction of an FTE based on hours worked.
Related Metrics
Commonly mistaken for:
Revenue per Employee (Includes all revenue types, not just ARR)
Profit per Employee (Accounts for costs, not just revenue)
ARR per Customer (Based on customers, not employees)
Related Metrics
Commonly mistaken for:
Revenue per Employee (Includes all revenue types, not just ARR)
Profit per Employee (Accounts for costs, not just revenue)
ARR per Customer (Based on customers, not employees)
Index