Assets Under Management
Growth
Industry:
Fintech
Short Definition
Assets Under Management (AUM) is the total market value of all assets a company manages or oversees for its users or clients — whether through investment portfolios, deposits, or pooled funds. It reflects the scale, trust, and revenue potential of a financial or wealth platform. In startup terms: “How much total money is being managed or moved through your platform?”
Why it matters for Investors
Scale and traction: AUM captures platform adoption and trust — it shows how much capital users are willing to place under management.
Revenue engine: Fintechs and robo-advisors often earn fees (e.g., 0.5–2%) directly as a percentage of AUM.
Predictable growth: Stable or rising AUM creates recurring, compounding revenue — the fintech equivalent of ARR.
Market confidence: AUM trends mirror investor sentiment and competitive position — net inflows = user confidence.
Valuation input: AUM multiples (e.g., enterprise value ÷ AUM) are used to benchmark fintech and asset-management startups.
Formula
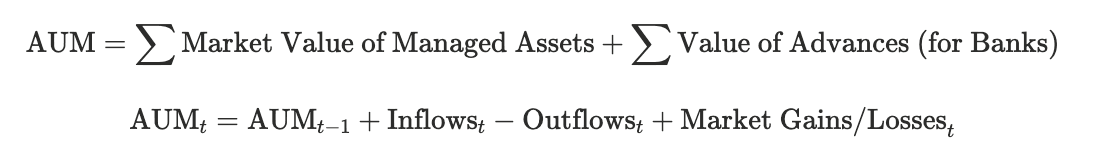
Where AUMₜ is AUM at time “t”
Practical considerations:
Market Value of Managed Assets: Include all investment portfolios, funds, ETFs, crypto assets, or deposits held and managed on behalf of customers — measured at current market value. (This captures what wealth or investment platforms actually manage.)
Value of Advances (for Banks / Lending Fintechs): Include outstanding loan balances, credit lines, or advances that are being serviced or managed. (This reflects the “assets” side of a lending business.)
Include: Any assets or accounts that your platform actively manages, advises on, or earns a fee from.
Exclude: Custody-only or pass-through funds that you hold but don’t manage, as they don’t generate management or performance fees.
Valuation frequency: Update AUM values daily for investment-linked products and monthly or quarterly for deposit-based or credit portfolios.
Currency conversion: Convert all holdings into a single reporting currency (e.g., USD or EUR) using current market exchange rates.
Growth source breakdown: Always split AUM movement between Net Inflows (new customer money) and Market Performance (returns or asset value changes) — this helps investors understand organic growth versus market lift.
Formula
Where AUMₜ is AUM at time “t”
Practical considerations:
Market Value of Managed Assets: Include all investment portfolios, funds, ETFs, crypto assets, or deposits held and managed on behalf of customers — measured at current market value. (This captures what wealth or investment platforms actually manage.)
Value of Advances (for Banks / Lending Fintechs): Include outstanding loan balances, credit lines, or advances that are being serviced or managed. (This reflects the “assets” side of a lending business.)
Include: Any assets or accounts that your platform actively manages, advises on, or earns a fee from.
Exclude: Custody-only or pass-through funds that you hold but don’t manage, as they don’t generate management or performance fees.
Valuation frequency: Update AUM values daily for investment-linked products and monthly or quarterly for deposit-based or credit portfolios.
Currency conversion: Convert all holdings into a single reporting currency (e.g., USD or EUR) using current market exchange rates.
Growth source breakdown: Always split AUM movement between Net Inflows (new customer money) and Market Performance (returns or asset value changes) — this helps investors understand organic growth versus market lift.
Worked Example
Component | Value | Notes |
|---|---|---|
Beginning AUM | $50,000,000 | Start of month |
New Deposits | $20,000,000 | From new and existing users |
Withdrawals | $(5,000,000) | Customer redemptions |
Market Gains | $2,000,000 | Portfolio appreciation |
Ending AUM | $67,000,000 | Calculated as $50 + ($20 − $5) + $2 |
AUM = $50M + ($20M − $5M) + $2M = $67M
Notes:
AUM vs. deposits: Deposits are user cash holdings; AUM includes invested assets that fluctuate with markets.
Net inflows: A strong metric for user trust and acquisition efficiency.
Market gains: Show product performance; AUM growth from returns boosts confidence and fee potential.
Startup lens: AUM growth ≠ new users only — it reflects both user onboarding and retention via engagement.
Best Practices
Accurate valuation: Use current market data to assess the value of managed assets and advances.
Regular updates: Recalculate AUM with each reporting period or significant client/fund change.
Segmentation: Analyze AUM by asset type, client segment, or loan category to identify trends.
Transparency: Disclose AUM calculation methods, including exclusions, in financial reports.
Risk management: Monitor AUM to assess exposure to market volatility or credit risk.
FAQs
Why do investors look at AUM for fintechs?
It’s the best proxy for market share, monetization potential, and brand trust — just like ARR is for SaaS.What drives AUM growth in fintech startups?
New user deposits, recurring auto-investments, portfolio returns, and cross-selling new asset products (e.g., crypto, ETFs, savings).Is higher AUM always better?
Not if fee yields are low. $1B in AUM at 0.1% fees earns less than $100M at 1% fees. Scale matters, but monetization quality matters more.Does AUM fluctuate daily?
Yes. Market changes, user withdrawals, and currency moves all affect daily reported AUM.What’s “Net New AUM”?
It’s the portion of AUM growth from new inflows minus withdrawals — excluding market performance. It shows real traction.
Related Metrics
Commonly mistaken for:
Revenue (AUM drives revenue but isn’t income itself; for asset or wealth fintechs, revenue often ≈ Take Rate % × AUM)
Total Payment Volume (activity through your platform, not value held or managed by your platform)
NAV (Net Asset Value) (Represents the per-share value of a single fund (total assets minus liabilities ÷ number of shares; NAV is for individual funds; AUM is the total value managed across all clients or products)
Source of:
Index