Average Order Value
Efficiency
Industry:
Sector Agnostic
Short Definition
Average Order Value (AOV) measures the average dollar amount customers spend per transaction over a given period. It answers: “When customers buy, how much do they spend on average?” AOV reflects both customer purchasing behavior and revenue efficiency per order.
Short Definition
Average Order Value (AOV) measures the average dollar amount customers spend per transaction over a given period. It answers: “When customers buy, how much do they spend on average?” AOV reflects both customer purchasing behavior and revenue efficiency per order.
Why it matters for Investors
Revenue driver: AOV multiplied by number of orders gives total revenue — it’s a core lever in topline growth.
Monetization signal: A rising AOV shows improved product bundling, upselling, or premium adoption.
Efficiency insight: A higher AOV can improve unit economics — fixed fulfillment or acquisition costs are spread over larger order values.
Pricing strategy test: Changes in AOV reveal how price adjustments or discounts affect buyer spend.
Investor takeaway: Sustainable AOV growth shows maturing customer relationships and potential for margin expansion.
Formula
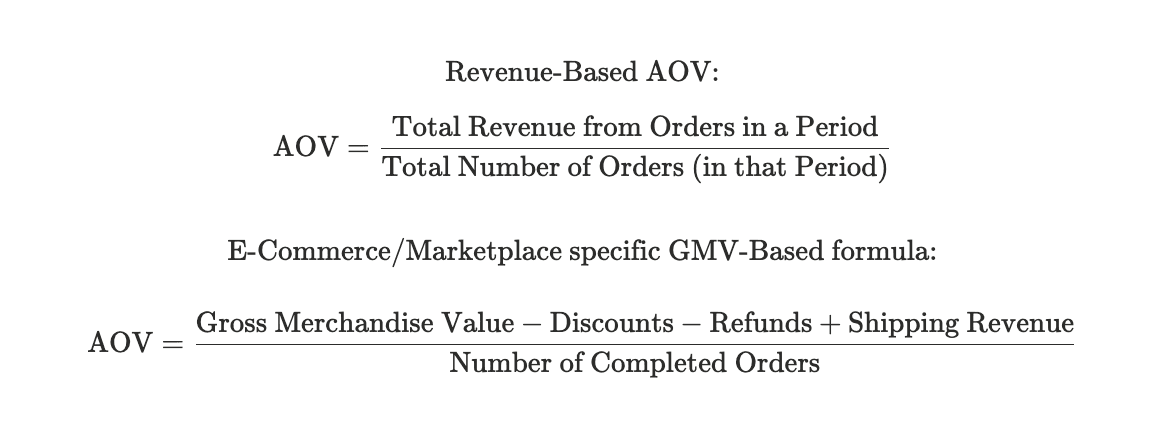
Practical considerations:
Gross Merchandise Value (GMV) = Total customer spend before deductions.
Revenue-based AOV focuses on what the company actually earns.
Marketplace AOV shows gross customer spend per order — useful for comparing platform activity.
Formula
Practical considerations:
Gross Merchandise Value (GMV) = Total customer spend before deductions.
Revenue-based AOV focuses on what the company actually earns.
Marketplace AOV shows gross customer spend per order — useful for comparing platform activity.
Worked Example
Order | GMV | Commission (10%) | Refunds | Discounts | Shipping Charged to Customer | Revenue | Notes |
|---|---|---|---|---|---|---|---|
A | $100 | $10 | $0 | $0 | $5 | $15 | You keep $10 + $5 shipping |
B | $200 | $20 | $0 | $20 | $5 | $25 | You gave a $20 seller discount but earned shipping |
C | $150 | $15 | $30 refund | $0 | $0 | -$15 | Refund wipes out your earnings |
GMV Based AOV = GMV/ Orders = ($100 + $200 + $150)/3 = $150 This is the average customer spending per order (what end customers pay, even if you don’t keep it all).
Revenue Based AOV = = Revenue/ Orders = ($15 + $25 - $15)/3 = $8.33 This is the average revenue retained per order (your true monetization).
Notes:
Include: Completed and paid orders only.
Exclude: Cancelled, test, or refunded orders from both numerator and denominator.
Discounts: Subtract coupons and promos from GMV to reflect real economic value.
Refunds: Deduct to avoid overstating AOV in periods with returns.
Shipping Revenue: Add if charged separately and recognized as part of revenue.
Taxes: Exclude sales tax/VAT (they are pass-throughs).
Currency: Normalize across geographies using current exchange rates.
Cohort tracking: Compare AOV across customer segments (new vs. repeat).
Best Practices
Track by segment: Split AOV by new vs. returning users — sustainable growth comes from returning users increasing spend.
Use median too: The mean AOV can be skewed by a few large orders; median AOV often reflects typical customer behavior better.
Pair with Customer Acquisition Cost (CAC) : High AOV relative to CAC shows efficient monetization.
Watch AOV vs. volume tradeoff: Increasing AOV via price hikes may reduce total order count — monitor elasticity.
Bundle smartly: Encourage upsells and multi-item carts to lift AOV organically.
FAQs
Is AOV the same as ARPU (Average Revenue per User)?
No. ARPU measures average revenue per customer, while AOV measures per order. Customers may place multiple orders, so ARPU ≤ AOV × Orders per User.Is Average Transaction Value (ATV) the same as Average Order Value (AOV)?
Yes, Average Transaction Value (ATV) and Average Order Value (AOV) measure the same underlying concept: the average revenue generated per customer order or transaction. Average Transaction Value (ATV) is used across any business model — retail, hospitality, SaaS, payments, POS systems. Average Order Value (AOV) is commonly used in eCommerce, marketplaces, or D2C brandsShould refunds and cancellations be included?
No — exclude refunded or cancelled orders to represent realized sales.Can AOV fall even when total revenue rises?
Yes — if order volume grows faster than order value (e.g., smaller, frequent purchases).How can founders increase AOV?
Upselling, bundling, raising free-shipping thresholds, loyalty tiers, or adding premium SKUs — all can lift average order size sustainably.
Related Metrics
Commonly mistaken for:
ARPU (Average Revenue per User) (user-level, not order-level)
ACV (Average Contract Value) (applies to SaaS/B2B, not retail orders)
GMV (total transaction value, not per-order average)
Related Metrics
Commonly mistaken for:
ARPU (Average Revenue per User) (user-level, not order-level)
ACV (Average Contract Value) (applies to SaaS/B2B, not retail orders)
GMV (total transaction value, not per-order average)
Components:
Index