Average Sales Cycle Length (Days)
Efficiency
Industry:
Sector Agnostic
Short Definition
Average Sales Cycle Length (Days) measures the average number of days it takes for a deal to move from initial qualification to final close (Closed‑Won or Closed‑Lost). It tracks how long the typical sales process takes — a key indicator of GTM (Go‑to‑Market) efficiency and revenue predictability.
Why it matters for Investors
Predictability signal: Short, stable sales cycles make revenue forecasts more reliable and reduce volatility.
Efficiency driver: Faster cycles mean less time and cost per closed deal, improving CAC payback periods and sales productivity.
Growth indicator: As a company matures, efficient sales cycles often reflect tighter product–market fit and better buyer understanding.
Cash‑flow impact: Shorter cycles accelerate bookings and cash collection, extending runway.
Scalability lens: Tracking cycle length consistency across segments and reps helps investors see if the sales motion can scale without slowing down.
Formula
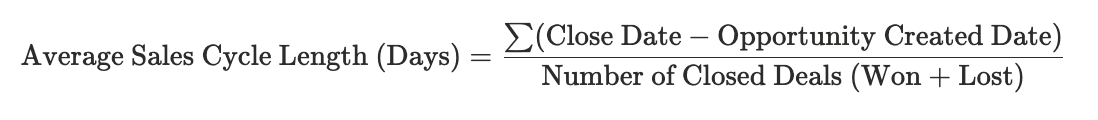
Practical considerations:
Stage boundary: Start at the moment an opportunity becomes qualified for sales (SQL stage) — not when the lead is first created.
Denominator clarity: The denominator metric is Number of Deals (Won + Lost) i.e all closed opportunities — both those won and lost — within a specific time period. It is not Pipeline – Number of Deals (i.e all active, in‑progress qualified opportunities (still open, not closed‑won or lost).
Include both wins and losses: Use all closed opportunities for more accurate trend data — not just the deals you won.
Segment for insight: Break down by product line, region, deal size, or channel (inbound vs. outbound). Enterprise deals naturally take longer.
CRM timestamps: Automate measurement using opportunity creation and close dates to minimize manual bias.
Watch extremes: Exclude outliers (e.g., stalled deals) if they distort averages — they can signal process issues but should be reviewed separately.
Formula
Practical considerations:
Stage boundary: Start at the moment an opportunity becomes qualified for sales (SQL stage) — not when the lead is first created.
Denominator clarity: The denominator metric is Number of Deals (Won + Lost) i.e all closed opportunities — both those won and lost — within a specific time period. It is not Pipeline – Number of Deals (i.e all active, in‑progress qualified opportunities (still open, not closed‑won or lost).
Include both wins and losses: Use all closed opportunities for more accurate trend data — not just the deals you won.
Segment for insight: Break down by product line, region, deal size, or channel (inbound vs. outbound). Enterprise deals naturally take longer.
CRM timestamps: Automate measurement using opportunity creation and close dates to minimize manual bias.
Watch extremes: Exclude outliers (e.g., stalled deals) if they distort averages — they can signal process issues but should be reviewed separately.
Worked Example
Opportunity | Value | Notes |
|---|---|---|
Opp. A | 60 days | Enterprise customer |
Opp. B | 45 days | Mid-market |
Opp. C | 30 days | SMB |
Opp. D | 65 days | Enterprise |
Opp. E | 40 days | SMB |
Average Sales Cycle Length = (60 + 45 + 30 + 65 + 40) ÷ 5 = 48 days
Notes:
The average time to close is 48 days, meaning it takes roughly 1.5 months to convert a qualified opportunity into a closed deal.
Reducing this length (e.g., from 48 → 35 days) shows process improvement, faster buyer conversion, or stronger product–market fit.
Tracking cycle trends across periods helps identify which changes (messaging, demo flow, sales enablement) actually speed deals up.
Best Practices
Benchmark by segment: Each customer type has a natural cycle length — SMB < Mid‑Market < Enterprise. Always compare apples to apples.
Track cohort sales cycles: Look at deals created in the same period to control for pipeline timing distortion.
Use median plus average: Median filters out extreme long deals that may skew averages.
Monitor early‑warning changes: Lengthening cycles can signal buyer hesitation, competitive pressure, or pricing issues.
Integrate into CAC modeling: Faster cycles generally reduce customer acquisition cost and improve payback periods.
Combine with Win Rate: Shorter cycles with increasing win rates indicate improving sales quality; shorter but dropping win rates may mean superficial qualification.
Automate visibility: Build dashboards in CRM (Salesforce, HubSpot) that track rolling 90‑day averages to visualize trends.
FAQs
Does including lost deals hurt accuracy?
No — it improves it. Only counting wins can give an unrealistically short cycle time since long or stalled deals often end up lost.Should renewals be included?
No. They represent existing customers and different buying processes — track only new and expansion deals.Why might the metric fluctuate period to period?
Small sample size or a few large enterprise deals can swing the average substantially; that’s why segmentation is key.Should I use calendar days or business days?
Use calendar days for consistency unless seasonality or holidays heavily distort actual cycle time.
Related Metrics
Commonly mistaken for:
Lead Response Time (Measures how quickly leads are followed up, not full deal duration)
Sales Velocity (Combines deal count, value, win rate, and cycle time — a broader “speed to revenue” measure)
Related Metrics
Commonly mistaken for:
Lead Response Time (Measures how quickly leads are followed up, not full deal duration)
Sales Velocity (Combines deal count, value, win rate, and cycle time — a broader “speed to revenue” measure)
Components:
Index