EBT Margin %
Efficiency
Financials
Industry:
Sector Agnostic
Short Definition
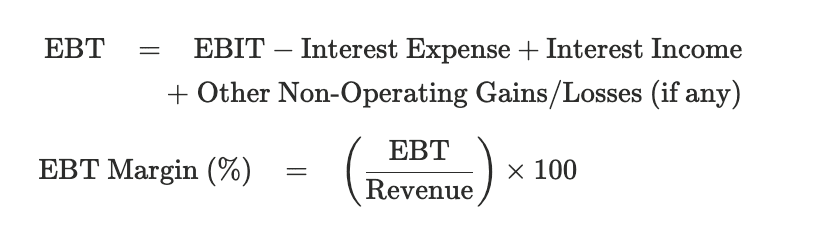
EBT Margin (%) measures how much of every dollar of revenue a company keeps as profit before taxes are deducted. It’s calculated by dividing Earnings Before Tax (EBT) by Revenue, then converting to a percentage. This margin shows the efficiency of operations and financing together — the profit earned after interest costs but before taxes.
Short Definition
EBT Margin (%) measures how much of every dollar of revenue a company keeps as profit before taxes are deducted. It’s calculated by dividing Earnings Before Tax (EBT) by Revenue, then converting to a percentage. This margin shows the efficiency of operations and financing together — the profit earned after interest costs but before taxes.
Why it matters for Investors
Pre‑tax profitability: Shows how well the company converts revenue into profit before accounting for taxes.
Financing signal: Captures the effect of interest income and interest expense on overall profitability.
Comparability: Lets investors compare performance across companies or regions with different tax rates.
Trend visibility: Tracking EBT Margin over time reveals whether financing costs or operating leverage are improving or eroding returns.
Leverage sensitivity: A falling EBT Margin with flat EBIT Margin can indicate rising debt costs or weaker cash management.
Formula
Practical considerations:
Consistent periods: Use EBT and Revenue from the same reporting period (quarterly or annual).
Pre‑tax only: Exclude any income‑tax expense or deferred‑tax entries — those affect Net Margin, not EBT Margin.
Interest inclusion: Reflects financing decisions — rising interest expense compresses EBT Margin even if operations are flat.
Cross‑comparisons: Ideal for comparing companies in different geographies or industries where tax rates vary.
Stage awareness: For early‑stage startups with little or no debt, EBT Margin will usually look very similar to EBIT Margin.
Worked Example
Line Item | Amount | Notes |
|---|---|---|
Revenue | $10,000,000 | Total sales during the period |
EBIT (Operating Income) | $2,500,000 | Profit before interest and taxes |
Interest Expense | $300,000 | Cost of loans or debt |
Interest Income | $50,000 | Earnings on cash or short-term investments |
EBT | $2,250,000 | $2,500,000 – $300,000 + $50,000 |
EBT Margin (%) | 22.5 % | ($2,250,000 ÷ $10,000,000) × 100 |
Notes:
EBT Margin (%) quantifies profit before taxes: the company retains 22.5 ¢ of pre‑tax profit for every $1 of revenue.
A higher margin means stronger earnings after financing costs; a lower margin can reflect higher leverage or weaker cost control.
Investor lens: If EBT Margin declines while EBIT Margin holds steady, it likely means interest burdens are rising.
Startup lens: Early‑stage firms may have little interest expense, so EBT Margin ≈ EBIT Margin — trends matter more than absolute numbers.
Best Practices
Report both EBIT and EBT Margins to show the effect of financing costs transparently.
Benchmark against peers with similar capital structures for apples‑to‑apples insight.
Track over time: Improving EBT Margin signals reduced financing pressure or better pricing power.
Disclose one‑offs: If interest income or expense is unusually high, note it so investors don’t misread profitability.
Pair with Net Margin: Helps identify whether changes stem from taxes or operating/financing shifts.
FAQs
What does EBT Margin (%) mean in simple terms?
It shows what portion of revenue remains as profit after paying interest but before paying taxes — a snapshot of pre‑tax profitability.How is it different from EBIT Margin (%)?
EBIT Margin ignores interest costs and interest income; EBT Margin includes them.Why track EBT Margin if I already watch Net Margin?
Net Margin mixes in tax‑rate effects. EBT Margin gives a clearer, tax‑neutral view of how financing and operations drive profitability.
Related Metrics
Commonly mistaken for:
EBIT Margin (%) (Excludes interest costs; measures purely operating profitability.)
Net Profit Margin (%) (Includes tax impact; measures after‑tax bottom‑line profit.)
Operating Margin (%) (Same as EBIT Margin in many cases; ignores financing and tax effects.)
Related Metrics
Commonly mistaken for:
EBIT Margin (%) (Excludes interest costs; measures purely operating profitability.)
Net Profit Margin (%) (Includes tax impact; measures after‑tax bottom‑line profit.)
Operating Margin (%) (Same as EBIT Margin in many cases; ignores financing and tax effects.)
Index