EBT
Financials
Industry:
Sector Agnostic
Short Definition
Earnings Before Tax (EBT) measures a company’s profitability after accounting for all operating and financing income and expenses, but before income taxes are deducted. It shows how much profit a company generates from both its operations and financial activities, independent of its specific tax environment.
Why it matters for Investors
Financing impact: EBT captures the effect of debt (interest expense or income), revealing how capital structure influences earnings.
Tax neutrality: By excluding taxes, investors can compare profitability across companies in different tax jurisdictions or with varied tax strategies.
Bridge to net income: EBT is the final profit measure before taxes — a critical step in understanding how operational and financing results translate into bottom‑line performance.
Valuation and credit insight: EBT helps assess the company’s ability to service debt from pre‑tax earnings and aligns with credit‑related ratios such as Interest Coverage.
Formula
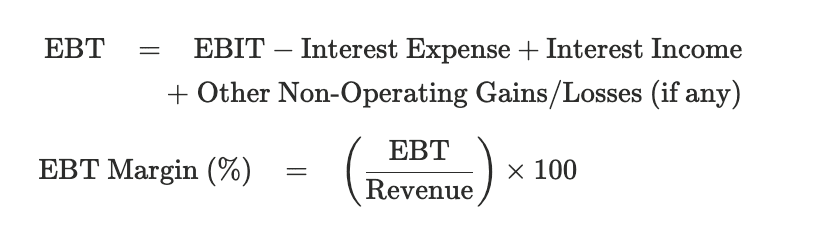
Practical considerations:
Include interest impacts: Subtract interest expense and add interest income to EBIT to derive EBT.
Exclude tax items: EBT stops before income tax provisions, deferred taxes, or tax credits.
Comparability: Useful when comparing companies with similar capital intensity but different tax rates.
Stage sensitivity: For startups or early‑stage firms with minimal interest expense, EBIT and EBT are often similar — differences matter more as leverage increases.
Consistency: Both EBT and revenue should use the same reporting currency and period.
Formula
Practical considerations:
Include interest impacts: Subtract interest expense and add interest income to EBIT to derive EBT.
Exclude tax items: EBT stops before income tax provisions, deferred taxes, or tax credits.
Comparability: Useful when comparing companies with similar capital intensity but different tax rates.
Stage sensitivity: For startups or early‑stage firms with minimal interest expense, EBIT and EBT are often similar — differences matter more as leverage increases.
Consistency: Both EBT and revenue should use the same reporting currency and period.
Worked Example
Line Item | Amount | Notes |
|---|---|---|
EBIT (Operating Income) | $2,500,000 | Profit from core operations, before financing and taxes |
Interest Expense | $300,000 | Cost of servicing debt or loans |
Interest Income | $50,000 | Income earned from cash balances or investments |
EBT (Earnings Before Tax) | $2,250,000 | $2,500,000 – $300,000 + $50,000 |
EBT Margin (%) | 22.5% | $2,250,000 ÷ $10,000,000 × 100 (assuming same revenue as EBIT example) |
Notes:
EBT shows how operating earnings (EBIT) are affected by the cost of financing decisions.
If the company had no debt or interest expense, EBT and EBIT would be identical.
EBT Margin is slightly lower than EBIT Margin due to interest cost.
Investors track this to assess how leverage and cash management influence profitability before tax obligations.
Comparing EBT year over year shows whether financing costs are rising or falling relative to core performance.
Best Practices
Bridge clearly: Present EBIT → EBT → Net Income in financial statements or investor decks.
Use for leverage analysis: Declining EBT margin alongside stable EBIT margin often signals rising debt burden.
Separate recurring vs. one‑time interest: For clarity, flag unusual or refinancing‑related interest charges.
Compare secular trends: Benchmark EBT margin to peers to isolate financing discipline.
FAQs
How is EBT different from EBIT?
Think of it as the next step down the profit ladder: EBIT shows profit from running the business — before interest and taxes. EBT adds in the effect of interest (for example, loan costs or interest earned on cash). EBT is basically your pre‑tax profit after financing costs are counted.Why should investors look at EBT instead of Net Income?
Taxes can vary a lot by country or company structure, so looking at EBT helps investors compare businesses before those tax differences. It shows how profitable the company is before taxes take their share.Does EBT include investment or interest income?
Yes. If the company earns interest from cash in the bank or short‑term investments, that income appears inside EBT.But unrealized or paper gains (like changes in investment value that haven’t been sold yet) usually aren’t included.Can EBT be negative while EBIT is positive?
Yes — this happens if the company pays more in interest or has other financial losses than it earned from its operations. In short, the core business might be profitable, but heavy debt costs can push EBT below zero.
Related Metrics
Commonly mistaken for:
EBITDA (Excludes D&A)
Operating Cash Flow (Adjusts EBIT for cash timing and working capital)
Net Income (After interest and tax)
Related Metrics
Commonly mistaken for:
EBITDA (Excludes D&A)
Operating Cash Flow (Adjusts EBIT for cash timing and working capital)
Net Income (After interest and tax)
Source of:
Components:
Index