Sales Quota per Rep
Growth
Industry:
Sector Agnostic
Short Definition
Sales Quota per Rep measures the total sales target assigned to an individual salesperson (sales representative or account executive(or AE)) over a given period — usually monthly, quarterly, or annually. It reflects the level of expected revenue contribution per rep and is a central planning metric for building realistic sales capacity and forecasting revenue.
Why it matters for Investors
Capacity planning: Shows how much each rep is expected to deliver, helping investors assess whether sales goals and headcount growth are aligned with topline targets.
Productivity signal: Used with Quota Attainment % to evaluate sales efficiency and performance health.
Revenue forecast anchor: Bottom‑up revenue models often start with Sales Quota per Rep × # of Reps × Attainment Rate.
Scalability indicator: High or growing quotas can signal improving average deal sizes or more efficient sales motion — or, if unrealistic, risk to hitting plan.
Benchmarking: Helps compare performance expectations across stages, geographies, or sales models (inside vs. field reps).
Formula
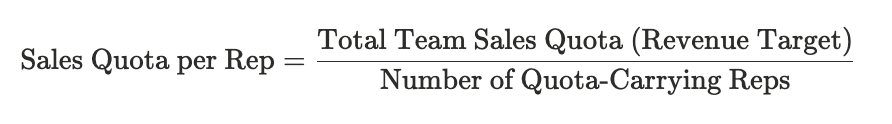
If set individually, use the assigned figure per rep (e.g., $1 million annual quota per AE).
Practical considerations:
Quota scope: Usually expressed in revenue ($), sometimes in units (sales volume) or bookings (ARR/ACV).
Time frame: Define clearly — monthly, quarterly, or annual quotas must match reporting period.
Include only quota‑carrying reps: Exclude Sales Development Representatives, managers, or support roles without direct revenue targets.
Calibration: Quotas should reflect territory potential, pipeline coverage, and historic attainment — avoid “stretch” quotas that distort performance data.
Stage awareness: Early‑stage companies may set lower quotas while refining go‑to‑market fit; later‑stage firms often push quotas higher as processes mature.
Currency consistency: Express all quotas in the same base currency for comparison.
Formula
If set individually, use the assigned figure per rep (e.g., $1 million annual quota per AE).
Practical considerations:
Quota scope: Usually expressed in revenue ($), sometimes in units (sales volume) or bookings (ARR/ACV).
Time frame: Define clearly — monthly, quarterly, or annual quotas must match reporting period.
Include only quota‑carrying reps: Exclude Sales Development Representatives, managers, or support roles without direct revenue targets.
Calibration: Quotas should reflect territory potential, pipeline coverage, and historic attainment — avoid “stretch” quotas that distort performance data.
Stage awareness: Early‑stage companies may set lower quotas while refining go‑to‑market fit; later‑stage firms often push quotas higher as processes mature.
Currency consistency: Express all quotas in the same base currency for comparison.
Worked Example
Item | Value | Notes |
|---|---|---|
Total Annual Revenue Target | $12,000,000 | Company sales goal for the year |
Quota-Carrying Reps | 12 | Account Executives with revenue quota |
Sales Quota per Rep | $1,000,000 | $12,000,000 ÷ 12 |
Notes:
Each rep is expected to bring in $1 million in annual sales.
If average quota attainment is 80 %, expected actual revenue = $800k × 12 = $9.6 million — the realistic forecast.
Comparing quota to average historical attainment helps check if the target is achievable or overly aggressive.
For investors, realistic quotas underpin credible revenue forecasts and reveal whether scaling is driven by people growth or productivity growth.
Best Practices
Link to attainment: Track average Quota Attainment % per cohort to validate realistic goal setting.
Recalibrate annually: Review quota levels as deal sizes, cycle times, and win rates evolve.
Tier by segment: Assign different quotas for enterprise vs. SMB reps; markets vary in deal potential.
Bottom‑up forecasting: Build revenue models starting from Sales Quota per Rep × Headcount × Attainment.
Incentive alignment: Set compensation plans so on‑target earnings (OTE) align naturally with quota levels.
FAQs
What exactly does “Sales Quota per Rep” show?
It shows how much revenue each salesperson is expected to bring in during a certain period — the target they need to reach to be “at quota.”How is it different from Quota Attainment?
Sales Quota per Rep is the target set. Quota Attainment % measures how much of that target a rep actually achieves.How do startups decide on quota levels?
Start with expected deal size × win rate × pipeline coverage. Adjust based on sales cycle length and attainable productivity for an average rep.
Related Metrics
Commonly mistaken for:
Quota Attainment (%) (Performance vs. target, not the target itself)
Sales Capacity (Resource count) (Number of reps, not revenue per rep)
Average Deal Size (Per deal, not per rep plan)
Related Metrics
Commonly mistaken for:
Quota Attainment (%) (Performance vs. target, not the target itself)
Sales Capacity (Resource count) (Number of reps, not revenue per rep)
Average Deal Size (Per deal, not per rep plan)
Index