Blog
•
The Complete Guide to Portfolio Data for VC Funds

VC funds today operate at a much larger scale than a decade ago. Average firm AUM has roughly tripled since 2015, and many now manage portfolios of 20–30+ companies across multiple sectors.
Funds have access to more data than ever: financials, KPIs, board updates, cap tables, and qualitative insights. According to the Data Driven VC Landscape, the number of data-driven VC firms has surged from 151 to 235 in just two years, with 65% now relying on internal tools, automation, and standardized processes to gain clearer visibility, reduce bias, improve predictions, and deliver better outcomes.
But the funds pulling ahead are the ones treating portfolio data as a core capability instead of a quarterly chore. Strong portfolio operations have become a true competitive edge, especially now that AI is becoming the default OS for sourcing, monitoring, valuations, and reporting. But AI is only as good as the data beneath it.
That is why strong portfolio data operations are now fundamental, not just back-office work. When data is collected, validated, and standardized, the same clean numbers power everything downstream and deliver:
Earlier detection of risks and opportunities
Faster, more defensible valuations and LP reporting
Proactive founder support and stronger governance
Reduced administrative drag, clearer portfolio-wide visibility, and AI you can actually trust
This guide serves as the operating manual for VCs, covering the process end to end: what to track, how to collect it without burning out founders, how to ensure accuracy and consistency, how to organize it for fast retrieval, and how to turn quarterly updates into reliable, actionable intelligence.
How VC Funds Use Portfolio Data
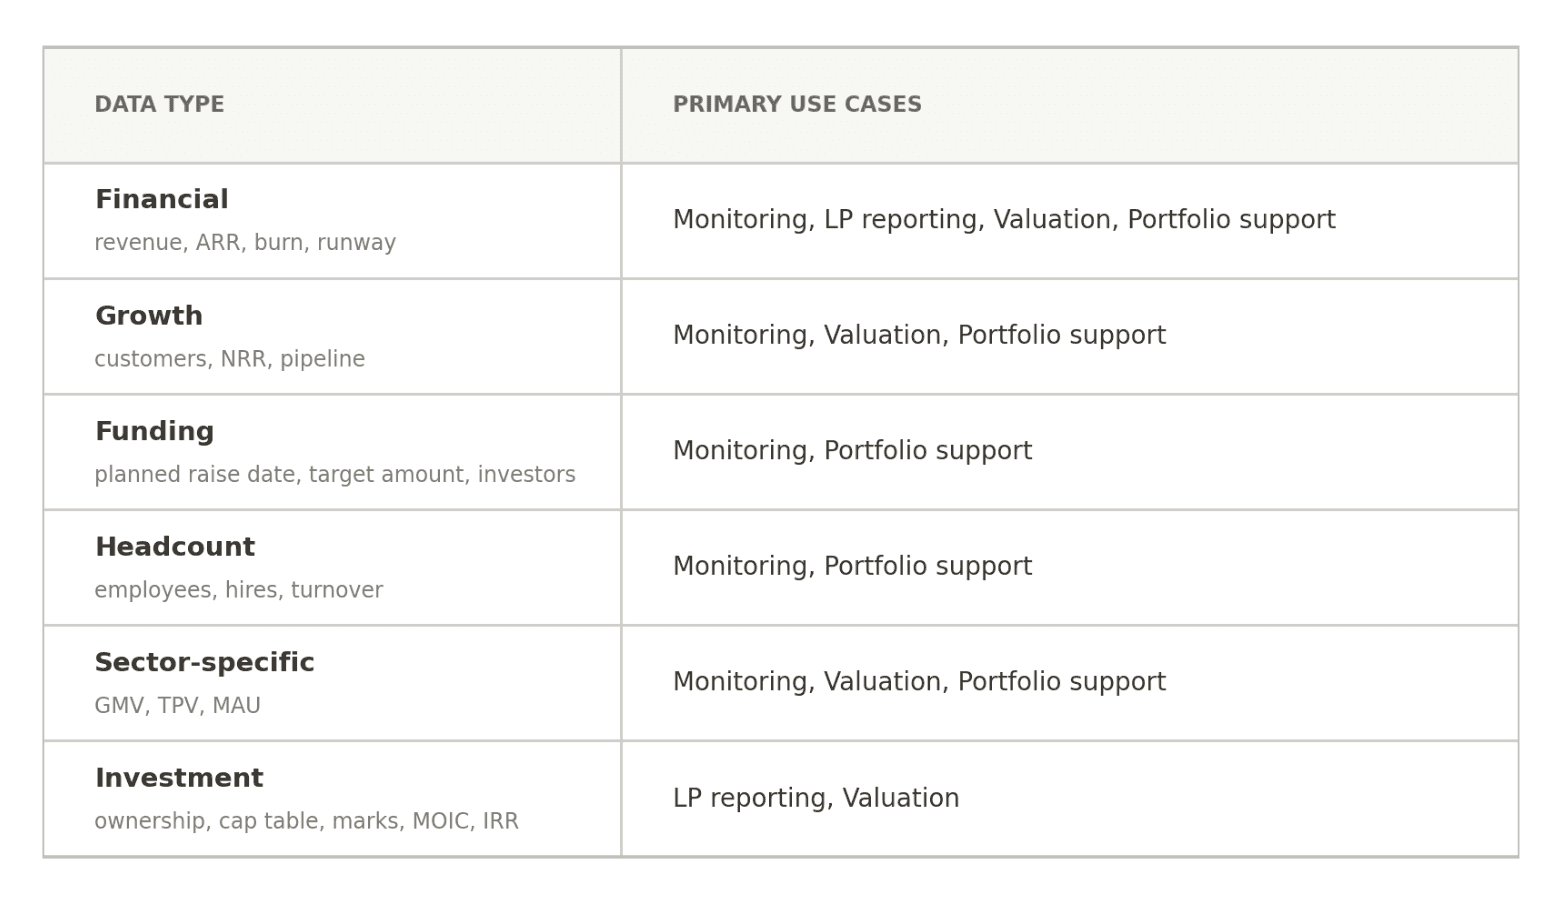
Leading VC funds rely on a single clean, standardized dataset to power four core areas: portfolio monitoring, LP reporting, valuation & performance tracking, and founder support/value creation.
Primary use cases include:
Real-time monitoring & decision-making: Spot trends, outliers, runway risks, and growth leaders in minutes. Enables proactive interventions and follow-on decisions.
LP reporting: Automatically populate quarterly letters with fund-level metrics (TVPI, IRR, MOIC, DPI) and portfolio highlights, turning weeks of work into hours.
Valuations & fund performance: Feeds ownership data, markups, and implied portfolio value for accurate TVPI, NAV, and audit-ready reporting.
Founder conversations & support: Provides data-backed insights for board meetings, benchmarking, and targeted help.
Since one dataset can feed all four use cases, the leverage is in collecting and standardizing the data once, instead of rebuilding the workflow every time.
This is the key difference between a data-aware and a data-driven team. Data-aware teams reach for numbers the way a defense attorney reaches for evidence, only to get out of a jam, while data-driven teams stay in a rhythm, returning to the data to answer one honest question: are we winning or losing?
A reliable data engine is what makes the second posture possible. It sharpens decisions, reduces risk, and strengthens fund operations at every level.
Which Startup Metrics to Track?
Not every portfolio company should be reporting on 10+ metrics, as each requested metric adds reporting work for the founder and lowers the odds of a complete, on-time response. Top funds typically focus on 8–15 core KPIs per company, tailored by stage and sector. Which is enough to understand a company’s financial health, growth momentum, and fundraising readiness.
Startup metrics generally fit into a few core categories, with business-model-specific metrics layered on top.
Financial Data
Financial metrics carry the most weight because they reveal how efficiently a company operates. They form the backbone for runway, valuation, and survival analysis.
Revenue remains the single best indicator of traction, while burn and runway are critical for risk monitoring, especially in volatile markets.
Growth & Operating Data
Growth metrics show whether the business is gaining traction and whether existing customers are expanding their usage over time. It’s essential for anticipating capital needs and follow-on dynamics: planned raise date and target amount, investor pipeline status, recent financing details (terms, valuation, participants).
However, they’re most useful when read against a benchmark. Take net revenue retention for example: 2025 SaaS data puts the median near 101%, while top performers reach 111% or higher. CAC payback runs about 20 months at the median, and anything under 12 months is considered strong.
Two companies with the same revenue growth can look very different once you add NRR and payback. One might be growing efficiently (high NRR, fast payback), while the other is burning cash to grow (low NRR, slow payback). Benchmarks tell you which is which.
Investment & Valuation Data
Investment and valuation metrics provide a clear picture of the fund's economic position in each portfolio company. They track ownership, changes in value over time, realized and unrealized returns, and future capital requirements, helping investors assess portfolio performance and make informed follow-on decisions.
Entry valuation, ownership percentage, and invested capital
Current fair market value / internal mark and date
MOIC (Multiple on Invested Capital) and implied position value
Post-money valuation from the last round
Cap table summary (fully diluted ownership, major shareholders, option pool)
Dilution trends and upcoming dilution events
Realized vs. unrealized returns
Follow-on reserve status
Funding Data
Fundraising signals work a little differently from the rest: they are less about a company's current health than about timing. They help you anticipate which companies are about to go back to market and which will run short before they get there. This data directly feeds your LP reporting and helps you decide where to add value in the fundraising process.
Planned fundraising date and target amount
Investor pipeline status
Recent financing details (terms, valuation, participants)
Funds commonly hold 40% to 60% of their capital in reserve for follow-ons. If you know six months ahead which companies will rise and how much, you can invest by choice rather than by necessity.
Headcount Data
People are often the largest expense line for venture-backed startups. They help you track the company’s operating health and act as a proxy for spending.
Total employees
New hires
Employee Turnover
Open roles
Hiring plan vs. actual
Sector-Specific Data
Sector-specific metrics need the most care during selection, because their definitions vary widely across sectors and rarely transfer cleanly between companies. Choose metrics that best reflect how the business creates value.
Sector | Key Metrics |
|---|---|
SaaS | NRR, CAC payback period, churn rate |
Fintech | TPV (total payment volume), take rate, fraud rate |
Marketplaces | GMV (gross merchandise value), take rate, liquidity ratio |
Healthcare | Patient volume, reimbursement rate, and capitation |
Consumer | MAU, engagement rate, viral coefficient |
That said, every portfolio company should report the same set of financial, growth, fundraising, and headcount metrics. Sector-specific metrics should be added on top, not replace the core dataset. This will create consistency across the portfolio.
How Portfolio Data Collection Works: A Step-by-Step Process
A reliable data collection process forms the backbone of effective portfolio foresight and proactive support. It repeats the same sequence every cycle, from the day an investment closes to a clean, queryable record.
Step 1: Onboard the Portfolio Company
The post-investment setup will determine the quality of data you work with for the rest of the holding. Aligning early on key metrics and reporting expectations prevents friction in the later stages and signals that your involvement is structured and supportive.
Schedule a dedicated onboarding session with the founder and their finance or operations lead. Walk through exactly what data you will request, the cadence, the rationale, and how it directly helps their company—whether through strategic introductions, hiring support, or board preparation.
Share a clear, concise template or one-pager outlining core metrics such as revenue or ARR, cash position, burn rate and runway, headcount, and 2–4 company-specific KPIs like customer acquisition cost or retention rates. Agree on metric definitions together to avoid future confusion.
Name the person on your side who owns the relationship. If you don’t name a single owner, requests fall through the cracks.
Set expectations collaboratively rather than contractually. Wherever possible, frame data collection as a shared process that helps you support founders more effectively. Leading firms like Andreessen Horowitz and Sequoia set clear reporting standards from day one, making it easier for founders to fit reporting into their existing workflows and stay consistent.
Step 2: Collect Data from Portfolio Companies
Send a recurring request on a fixed schedule: quarterly for most metrics, monthly for cash and burn at the companies you are watching closely. This establishes a predictable, low-friction collection rhythm tailored to each company’s needs. Most funds collect data quarterly for most metrics. And pull cash and burn numbers monthly for the companies they’re watching most closely.
You can pick one of the two data collection methods:
Template: Founders fill in a fixed form every time. This produces tidy data when completed, but adds friction and breaks the moment a company measures something differently than the form expects. Such templates also build trust, because both sides know exactly which numbers will appear and how they are defined, so the quarterly conversation becomes predictable instead of adversarial.
Collecting what the company already produces: If not a fixed form, collect the company’s board deck, financials, and update email, and structure that on the fund's side. This removes the founder's busywork at the cost of more processing for the fund.
Either way, response rates rise with the same habits: keep the request short, keep the deadline fixed and cyclical, and make submitting as easy as forwarding an email. Explain why each metric matters, so you’re not creating pressure without adding more support. Your goal should be to collect complete, updated data without exhausting the founder.
Step 3: Check the Portfolio Data for Accuracy
Incorrect portfolio data is often more damaging than delayed data. Every benchmark, valuation, and portfolio insight depends on the quality of the underlying numbers. If the data is wrong, the conclusions will be too.
This is where many data collection processes break down. Modern extraction performs well on clean, structured documents, often exceeding 95% accuracy. But it’s much weaker on the messy formats portfolios actually send. For example, on multi-column financial statements, traditional OCR can fall to 40% to 60% accuracy while AI vision models reach only about 67-80% in real-world financial contexts, with persistent issues in numerical signs, alignments, merged cells, and multi-column layouts. Common challenges to consider:
Look-alike metrics (e.g., bookings vs. recognized revenue, gross vs. net revenue) are frequent sources of distortion
Multi-page, borderless, or scanned statements that amplify errors in the extraction of dates, units, and totals
Changes in reporting methodology that go undocumented.
Human-in-the-loop validation can dramatically improve outcomes here. Combining AI with targeted human review routinely pushes overall accuracy past 95-99%, reducing critical errors in high-stakes financial extraction.
Spot-check the formats and sections AI handles worst (dense tables, mixed layouts). Reconcile anomalies directly against source documents. Prioritize human judgment on confusing metrics like bookings/revenue or gross/net to build trustworthy portfolio intelligence at scale.
Step 4: Standardize Metrics Across the Portfolio
Standardization is the key to making a portfolio comparable. Without it, portfolio-level aggregates are unreliable. This is because the same startup metric—such as ARR—often hides major differences: it can reflect contracted (CARR, including signed but not-yet-live deals), recognized (GAAP-aligned), or forward-looking run rates, and gross versus net of churn/downsells.
Data highlights the problem
"Committed" or contracted ARR can overstate actual ARR because it includes deals that may never convert. Some are signed but churn before they go live, so the headline figure includes revenue that never arrives (SaaS Metrics Standard Board).
ARR is not a GAAP metric, so companies define it however they like: counting setup fees, annualizing one strong month, or booking multi-year contracts as current revenue. Each choice skews growth, retention, and valuation (Ordway).
Result: Two companies with the same headline ARR can have very different revenue quality, cash predictability, and Rule of 40 performance, leading to valuation differences of 2–3x or more.
Until definitions are pinned down (with documented policies, waterfalls, and reconciliations to financials), any portfolio-level number rests on shaky ground.
Use one definition for each metric across every company, with consistent ARR rules, fiscal years, currencies, and edge-case treatment. Document how each metric is calculated and preserve historical definitions so benchmarks remain accurate over time.
Step 5: Organize and Store the Documents
Collecting documents is only half the job. The other half is making sure the right file can be found in seconds, whether for an LP request, audit, diligence process, or internal review.
This is important because VCs can spend 40% of due diligence time just locating documents. Poorly organized data rooms also delay diligence by 3-6 weeks and reduce investor confidence.
A consistent folder structure and naming convention across the portfolio make the job easier. Institutional VC data rooms typically use numbered top-level folders (e.g., 01 Legal, 02 Financials, 03 Portfolio Company Materials, 04 Fund Models) aligned with ILPA or standard diligence flows. This mirrors LP expectations and prevents hunting.
Add role-based access so the right people see the right files, version control so nobody works off a stale copy, and a retention rule for how long each document type is kept.
Common Portfolio Data Management Challenges
Challenge | What goes wrong | The cost |
|---|---|---|
Low response rates | Long data requests or awkward formats get deprioritized | Late and partial submissions become the norm, and the follow-up needed to close the gap quietly eats the ops team's quarter |
Manual entry & spreadsheets | Data must be copied, reconciled, and rechecked by hand. Reporting depends on repetitive copy-paste workflows | 200–500 hours spent collecting and cleaning data each year |
Inconsistent metric definitions | Companies use different formulas for the same metric | Benchmarks break, and roll-ups require constant manual normalization |
Fragmented systems | Data scattered across email, drives, CRMs, and sheets | No single source of truth |
Thin history | Historical data lives in disconnected files. Past reports are hard to find or compare | No reliable trend analysis or portfolio benchmarking. Performance changes are harder to spot early |
Many funds continue to rely on spreadsheets, completely overlooking the hidden risks in portfolio oversight. Spreadsheets are notoriously error-prone: Up to 94% of business spreadsheets contain errors, and complex ones often have multiple. Some emerging managers call it the "spreadsheet tax," and those who move off manual tooling have reported saving 200 to 500 hours a year. It also increases the chance of compliance oversights in AI and data risk tracking.
Fragmented systems create serious blind spots. When the numbers are scattered across email, shared drives, CRMs, and a dozen spreadsheets, there is no single source of truth. Funds get different answers to the same question depending on who you ask and when. This erodes trust in the numbers and increases the risk of reporting errors, missed compliance obligations, and incomplete visibility into portfolio-wide AI and data risks.
What Great Portfolio Data Operations Look Like
A few traits show up again and again in every great portfolio data program. To note a few:
Clear frameworks. Every portfolio company knows exactly what to report, how metrics are defined, and when data is due. This eliminates ambiguity and sets expectations from the onboarding itself.
An industrial process, not an artisanal one. Pulling a metric should be repeatable and near-automatic. You want a link to a report that spits out the figure, not a late-night scramble to assemble a spreadsheet before a board meeting. If pulling a metric requires a person and a half-day, then your efforts will fail at scale.
One source of truth, with real investment behind it. Leading operators treat data as infrastructure rather than an administrative task. EQT's Motherbrain is a well-known example. Founded in 2016, the in-house AI and data platform supports the full investment lifecycle, from sourcing opportunities to portfolio value creation, demonstrating how deeply integrated data can improve decision-making across a large investment organization.
Now, most funds will never build their own AI platform, but the principle scales down: one place where the numbers live, instead of a dozen.A structured repository organized by company, reporting period, and metric type, with version control and strong searchability.
Seamless links between quantitative data, source documents, board decks, and qualitative notes.
Quick retrieval for portfolio reviews, LP reporting, or ad-hoc analysis—cutting manual effort dramatically.
Standardized, accurate, and comparable data. Over 70% of VCs report that poor data quality leads to missed opportunities or slower decisions. Teams with great portfolio ops create a common language across the portfolio to overcome this, enabling true benchmarking, trend spotting, and outlier detection.
You align on precise definitions (e.g., net burn, revenue recognition, cohort retention) during onboarding and maintain a shared reference guide.
Your team performs thoughtful spot-checks against board materials, financial statements, and other touchpoints to ensure reliability without creating friction.
Standardized views enable true apples-to-apples benchmarking, trend identification, and outlier detection at the portfolio level.
A culture of transparency: Great operations build a culture where teams feel safe reporting bad news early. Problems are fixable, secrets are not. Regular, predictable reporting reduces surprises and shifts the conversation from explaining problems to solving them.
Portfolio-wide visibility. Clean, consistent data lets the fund answer key questions in minutes—fastest growers, runway risks, portfolio shifts over time.
Work backward from the decisions data must support. Select a focused set of tied metrics, lock definitions before scaling, and assign ownership.
How to Assess AI and Data-Compliance Risk Across Your Portfolio
AI and data compliance have become important parts of portfolio monitoring. Funds need visibility into where portfolio companies use AI, where customer data is stored and processed, which markets they operate in, and which regulations apply.
This is becoming increasingly important as new rules surface, such as the EU AI Act, which is already reshaping how portfolio companies operate and scale.
Key checks per company
Model dependency: Reliance on third-party foundation models (e.g., OpenAI, Anthropic), fine-tuning practices, and data used for training.
Data processing: Where customer/personal data is stored/processed, lawful basis (GDPR), and flows to sub-processors.
Customer location & risk tier: EU exposure, high-risk use cases (e.g., employment, biometrics, credit scoring), and prohibited practices.
Rate each company’s exposure on compliance, regulatory, operational, and reputational risk. This gives investors a clear view of where the biggest risks are emerging and which companies may require closer attention.
What Does the EU AI Act Mean for VC Portfolios?
The EU AI Act (entered into force August 2024) is the world’s first comprehensive AI regulation. It uses a risk-based framework: prohibited practices, high-risk systems (Annex III), general-purpose AI (GPAI) models, and transparency obligations. Non-compliance penalties can reach 7% of global annual turnover.
Key deadlines (phased rollout)
Feb 2, 2025: Prohibited AI systems banned; AI literacy obligations begin.
Aug 2, 2025: GPAI model obligations apply (transparency, documentation); earlier models get until 2027.
Aug 2, 2026: Most other obligations, including high-risk systems in Annex III.
2027+: Full high-risk requirements (some extended to late 2027/2028).
Implications for funds and portcos
Early-stage startups using AI in sensitive areas (HR, finance, biometrics) face high compliance costs and potential redesigns. VCs should map portfolio exposure now. Many AI startups depend on external models or process EU customer data, triggering obligations regardless of company size.
Inventory AI use cases and risk tiers
Ensure data governance (provenance, minimization, DPAs)
Prepare for transparency and human oversight
Monitor updates via regulatory sandboxes where available.
From Data Collection to Portfolio Monitoring
Collecting, validating, and standardizing data, as the guide outlines, is what lays the groundwork for effective portfolio monitoring. Once the numbers are prepped and reliable, funds can shift focus from backward-looking reporting to forward-looking insight: spotting flattening growth, shrinking runway, rising burn, or the early-warning patterns that often surface two or more quarters before they become crises. That shift pays off in a few ways:
Immediate visibility into portfolio health and outliers
Proactive founder support and stronger governance
Accurate LP reporting and defensible valuations
The ability to turn numbers into timely decisions at scale
This way, portfolio data moves from quarterly paperwork and administrative costs to a true compounding asset, forming the foundation for repeatable, effective monitoring systems.
How PortfolioIQ Helps
This guide delivers value no matter what tools you use. But PortfolioIQ is purpose-built to automate these exact steps, so your team spends less time chasing, cleaning, and reconciling data.
Collect portfolio data reliably. Forward a board deck, financial statement, update email, or data room link. It extracts the numbers and documents automatically, without forcing rigid templates.
Human-verified accuracy. AI extracts the data, then dedicated analysts review every critical figure against the original source—delivering the human-in-the-loop validation this guide recommends for >99% reliability on messy financials.
True standardization at scale. Metrics are automatically aligned to your definitions (ARR, net burn, gross vs. net, etc.), with clear audit trails back to source documents. No more comparing apples to oranges across the portfolio.
Single source of truth. All KPIs, source documents, board materials, and valuations live in one searchable, version-controlled repository. Generate portfolio views, benchmarks, LP reports, and dashboards on demand.
Frequently Asked Questions
What data should VCs collect from portfolio companies?
Collect a small core set: revenue, ARR or MRR, gross margin, burn, cash, runway, and headcount. Add more sector-specific or business-specific metrics, like net revenue retention and CAC payback for SaaS, or GMV for marketplaces. Just keep the list short.How often should a fund collect portfolio data?
Quarterly for most metrics, and monthly for cash and burn at the companies you are watching closely. What matters most is a fixed, repeating schedule, not how often you ask.How do you onboard a new portfolio company into reporting?
Do it in the first 90 days. Create the company's record, agree on which metrics to collect and what they mean, set the schedule and deadline, confirm the format, and pick one person to own it. Write it all down. Getting this right at the start sets the data quality for the whole investment.Should you use a reporting template or let companies send what they have?
Both work. Templates build consistency and trust, but add friction and break when a company measures something differently. Collecting what companies already produce removes founder busywork but moves the cleanup to you. Either way, keep the request short and the deadline fixed.How do you standardize metrics across a portfolio?
Give every metric one shared definition and apply it to every company before the data goes into your system. The same metric can mean different things (ARR can be contracted, recognized, or forward-looking, gross or net), so keep a definitions list, line up fiscal years and currencies, and keep each company's own label next to your standard one.How should a fund organize and store portfolio documents?
Pick one folder structure and one naming rule, and use them for every company. A simple setup is folders by type: legal, financials, the fund model, and company materials. Add access controls, version control, and a rule for how long to keep each type.How does the EU AI Act affect portfolio companies?
It rolls out in stages. On August 2, 2026, most of the rules apply and enforcement starts, with the toughest high-risk rules pushed to late 2027. For a fund, the job is to know which companies build or use higher-risk AI, and which serve EU customers.