Current Assets
Financials
Industry:
Sector Agnostic
Short Definition
Current Assets are short-term assets expected to be converted into cash, sold, or consumed within one year or one operating cycle, whichever is longer. They include cash, accounts receivable, inventory, and other liquid assets readily available to meet operational needs.
Short Definition
Current Assets are short-term assets expected to be converted into cash, sold, or consumed within one year or one operating cycle, whichever is longer. They include cash, accounts receivable, inventory, and other liquid assets readily available to meet operational needs.
Why it matters for Investors
Liquidity assessment: Indicates the company’s ability to pay short-term obligations.
Operational efficiency: Reflects how well assets are managed and converted to cash.
Financial health signal: A high proportion of current assets to liabilities suggests lower short-term risk.
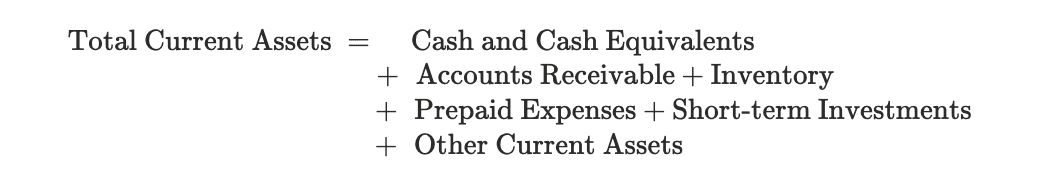
Formula
Practical considerations:
Classification test: Include only assets expected to be realized within one year or the normal operating cycle, whichever is longer.
Cash equivalents: Short‑term, highly liquid instruments (e.g., Treasury bills, money market funds) with maturities under 3 months.
Receivables: Net of allowance for doubtful accounts; monitor aging for credit risk.
Inventory: Valued at lower of cost or net realizable value; obsolescence reduces liquidity.
Prepaid expenses: Future economic benefit — e.g., insurance, rent — that will be used within the year.
Exclude: Long‑term investments, fixed assets, goodwill, or deferred tax assets.
Trend tracking: Compare quarter‑over‑quarter to detect working capital buildup or drawdown.
Worked Example
Line Item | Value | Notes |
|---|---|---|
Cash & Cash Equivalents | $800,000 | Immediately available funds — checking accounts, petty cash, and money market funds with maturities ≤ 3 months |
Short-Term Investments | $400,000 | Treasury bills and certificates of deposit maturing within 12 months (slightly less liquid than cash) |
Accounts Receivable | $600,000 | Expected customer payments, net of allowance for doubtful debts |
Inventory | $300,000 | Raw materials, work-in-progress, and finished goods intended for sale |
Prepaid Expenses | $100,000 | Prepaid insurance and rent to be expensed within the next 12 months |
Other Current Assets | $100,000 | Employee advances, short-term deposits, or recoverable taxes |
Current Assets = $800,000 + $400,000 + $600,000 + $300,000 + $100,000 + $100,000
= $2,300,000
Notes:
Liquidity Profile:
The first two lines (Cash + Short‑Term Investments = $1.2 M) represent liquid assets — roughly 52% of total Current Assets, showing a solid cash position.
This liquidity buffer improves runway and short‑term resilience.
Receivables Insight:
$600 K in receivables (~26%) indicates revenue already earned but not yet collected.
Investors should analyze Days Sales Outstanding (DSO) to ensure efficient collections. A rising DSO could pressure cash flow.
Inventory Dynamics:
$300 K (~13%) is typical for product or hardware companies but high for software or services firms.
Rising inventory may signal slower sales or overproduction; declining inventory with rising revenue signals efficient turnover.
Prepaid and Other Assets:
Small relative share (~9%) — good sign that the company isn’t tying up significant cash in non‑productive prepayments.
However, these assets can smooth monthly expenses and aid predictability.
Liquidity Ratio Example:
Suppose Current Liabilities = $1,500,000
→ Current Ratio = 2,300,000 / 1,500,000 = 1.53
→ A ratio above 1.0 implies short‑term assets exceed near‑term debts — generally healthy liquidity.
Excluding inventory (for quick ratio):
→ (2,300,000 – 300,000) / 1,500,000 = 1.33, still sound.
Investor Takeaway:
The company holds enough near‑term assets to meet obligations comfortably.
Strong liquidity supports growth flexibility and reduces financing risk.
Key to monitor: composition over time — a shift from cash to receivables may indicate working capital stress even if totals stay flat.
Best Practices
Link to Working Capital: Track Current Assets – Current Liabilities to monitor liquidity buffer.
Monitor composition: Favor a higher share of cash and receivables versus inventory for rapid liquidity.
Benchmark by industry: Asset mix varies — SaaS firms have minimal inventory; manufacturing has more.
Align with cash flow: Ensure growth in Current Assets is matched by operating cash inflow, not burn.
FAQs
What qualifies as a Current Asset?
Anything expected to turn into cash or be used up within a year — cash, short‑term investments, receivables, inventory, and prepaid expenses.Are marketable securities part of Current Assets?
Yes, if they’re short‑term (mature within 12 months) and easily convertible to cash. Long‑term investments go under non‑current assets.Why are Current Assets important for startup investors?
They determine how quickly a company can fund daily operations without additional capital — a key signal of runway and financial discipline.What does a rising Current Assets balance mean?
It can reflect revenue growth (more receivables, more inventory) — or inefficient cash management if increases aren’t matched by cash collection.
Do all industries have similar Current Asset levels?
No. Asset‑light startups (e.g., SaaS) typically have smaller Current Assets relative to revenue, while manufacturing or retail businesses hold more working capital.How do Current Assets affect runway?
More cash and near‑cash items extend runway, while high receivables or inventory can trap liquidity, shortening it.
Related Metrics
Commonly mistaken for:
Total Assets (Includes non-current assets like Plant,Property & Equipment and intangibles)
Current Liabilities (Obligations, not assets, due within one year)
Related Metrics
Commonly mistaken for:
Total Assets (Includes non-current assets like Plant,Property & Equipment and intangibles)
Current Liabilities (Obligations, not assets, due within one year)
Source of:
Components:
Index