FUND PERFORMANCE ANALYSIS

Quarterly Fund Marks

You know the status of individual positions. Here's how to use AI to aggregate them into a fund-level dashboard and pinpoint which positions drove the quarter’s performance.

AI prompts for quarterly fund marks movers
  1. Build the fund-level dashboard

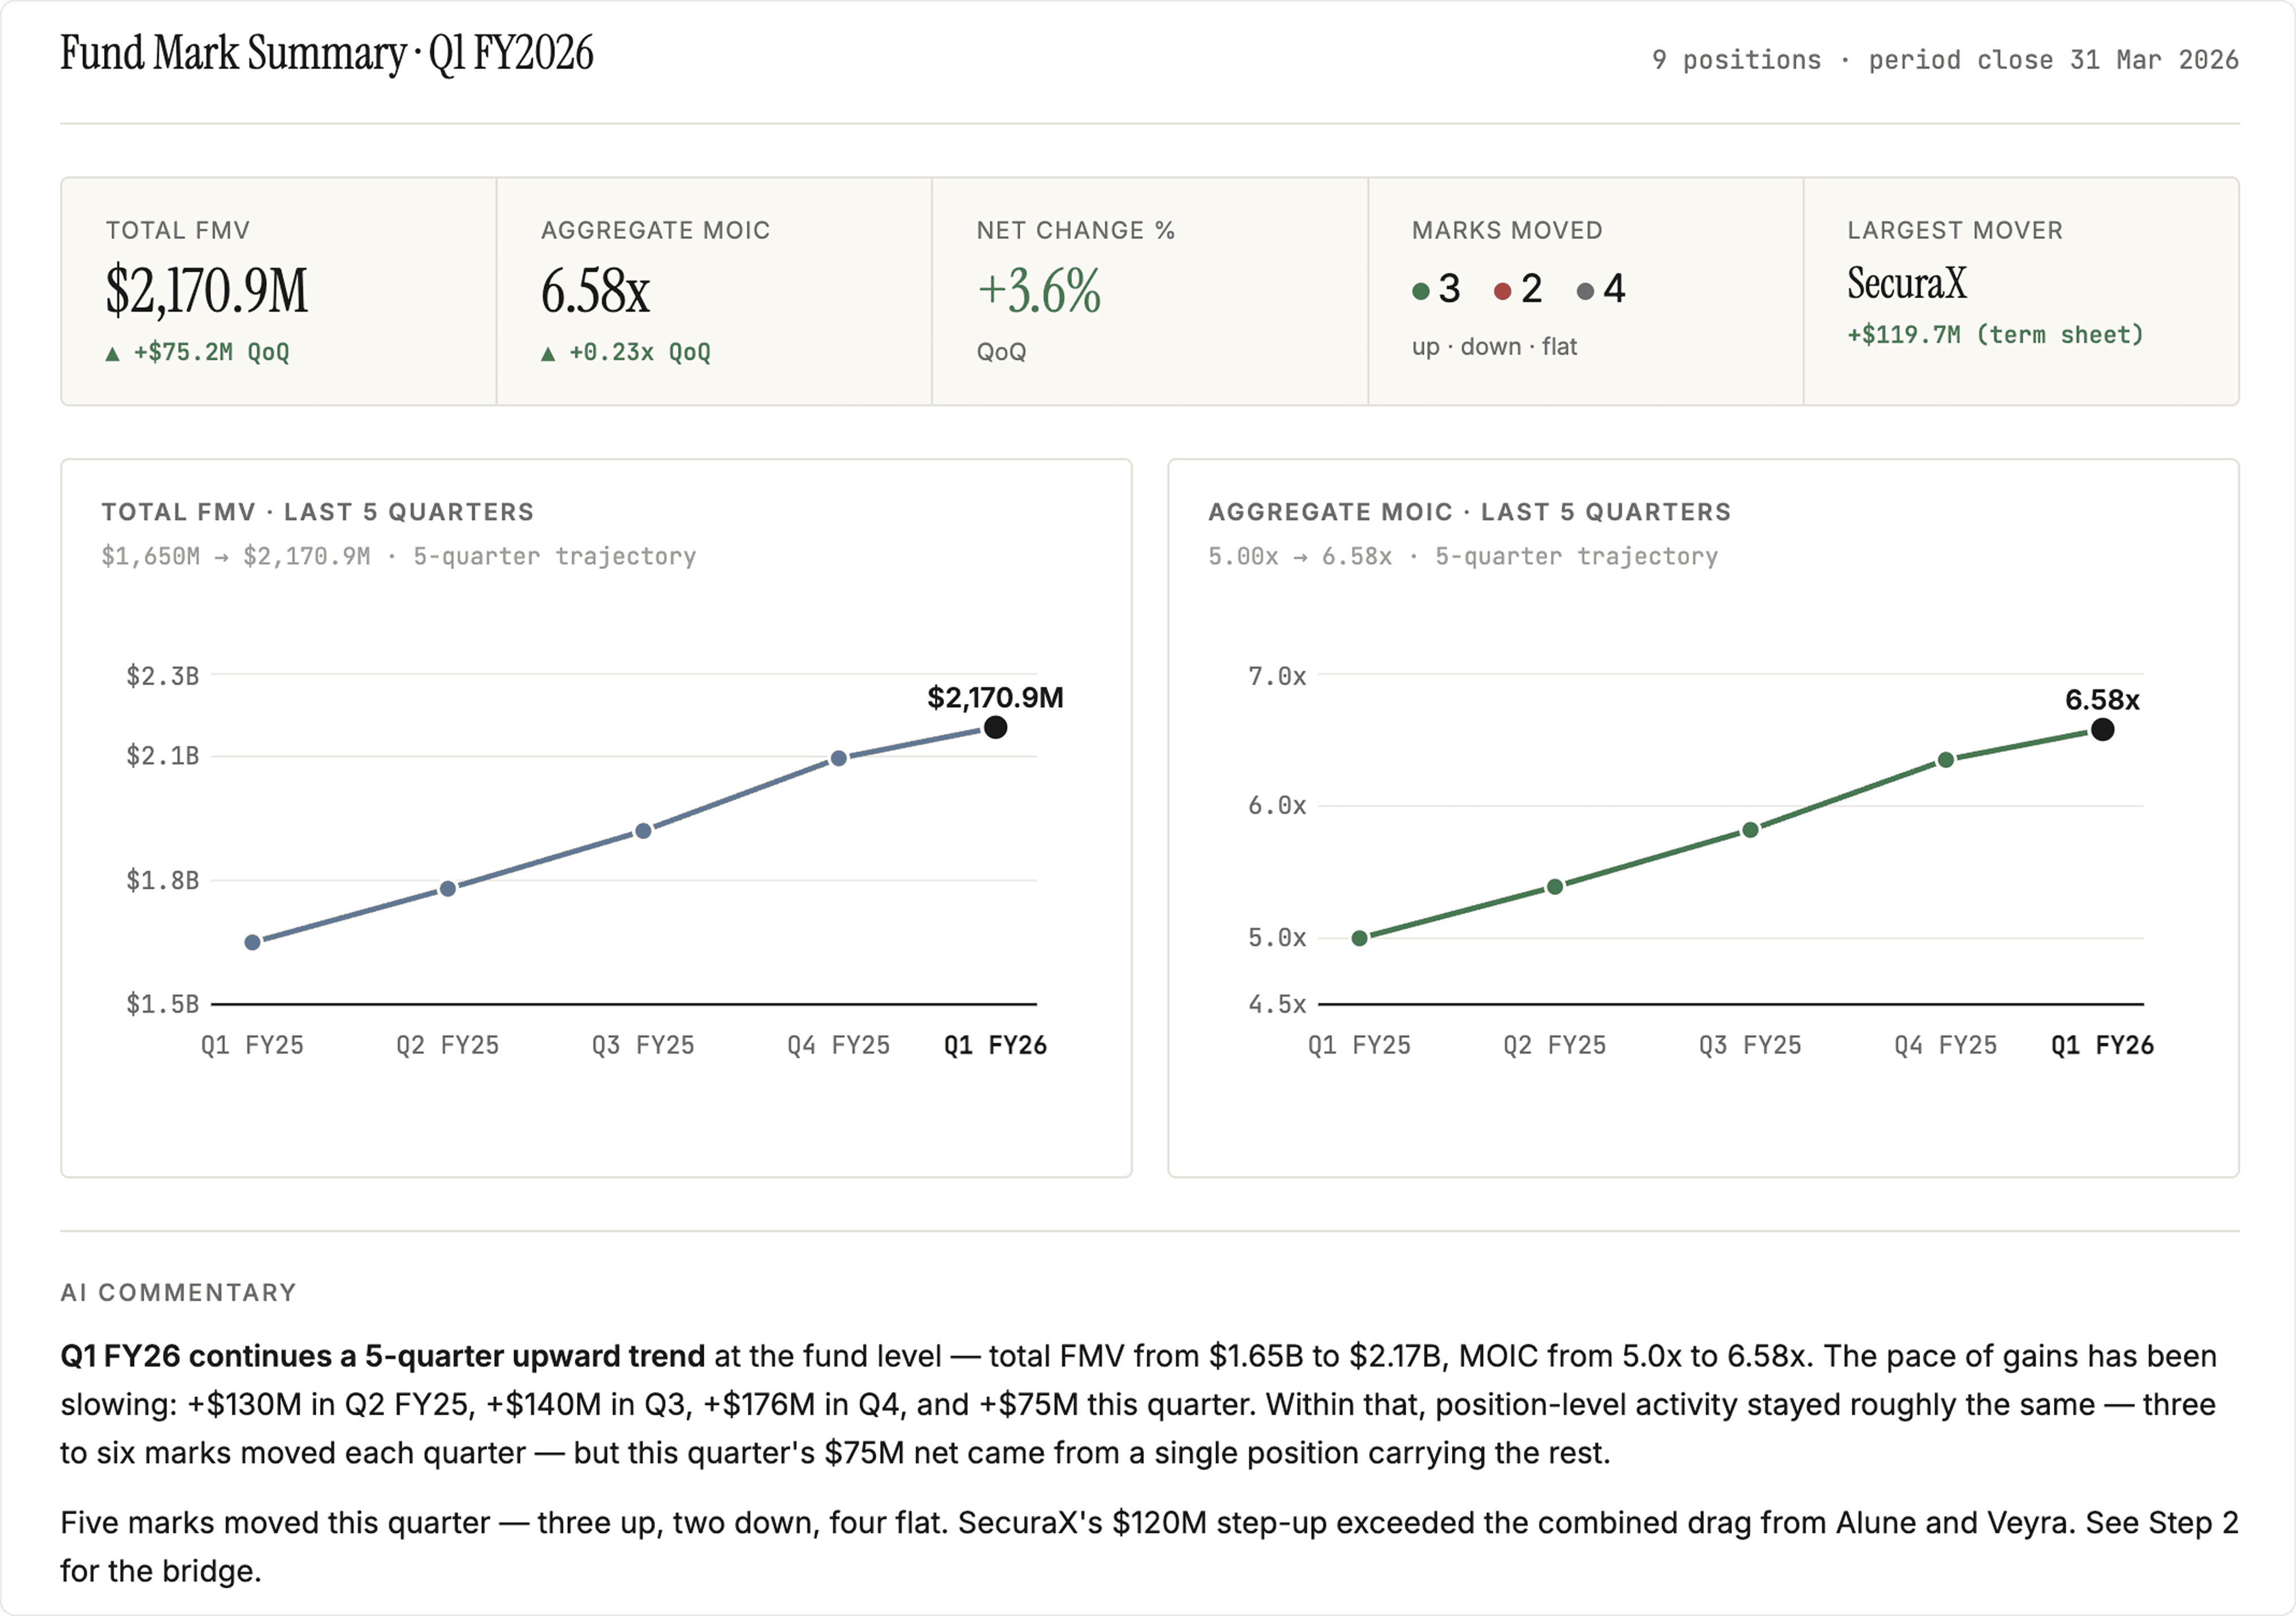
A fund-level dashboard combines current fund totals with a five-quarter trend, letting you immediately see whether the current quarter continues the pattern or breaks from it.

Prepare your data

Per-holding FMV across the last five quarters and aggregate fund MOIC for the same period.

Prompt

For [fund name], build a one-screen fund dashboard for the quarter, in trend context: - KPI strip with current values: total FMV (with QoQ change), aggregate MOIC (with QoQ change), net % change, count of marks up / flat / down, name of the largest single mover - Two trend charts side-by-side: total FMV across the last five quarters; aggregate MOIC across the last five quarters. Mark the current quarter clearly. - 2–3 sentence commentary on where this quarter sits in the trajectory — is the direction the trend, or a break from it? No per-position breakdown yet.

For [fund name], build a one-screen fund dashboard for the quarter, in trend context: - KPI strip with current values: total FMV (with QoQ change), aggregate MOIC (with QoQ change), net % change, count of marks up / flat / down, name of the largest single mover - Two trend charts side-by-side: total FMV across the last five quarters; aggregate MOIC across the last five quarters. Mark the current quarter clearly. - 2–3 sentence commentary on where this quarter sits in the trajectory — is the direction the trend, or a break from it? No per-position breakdown yet.

Copy prompt

Copied

Output
Fund mark summary chart
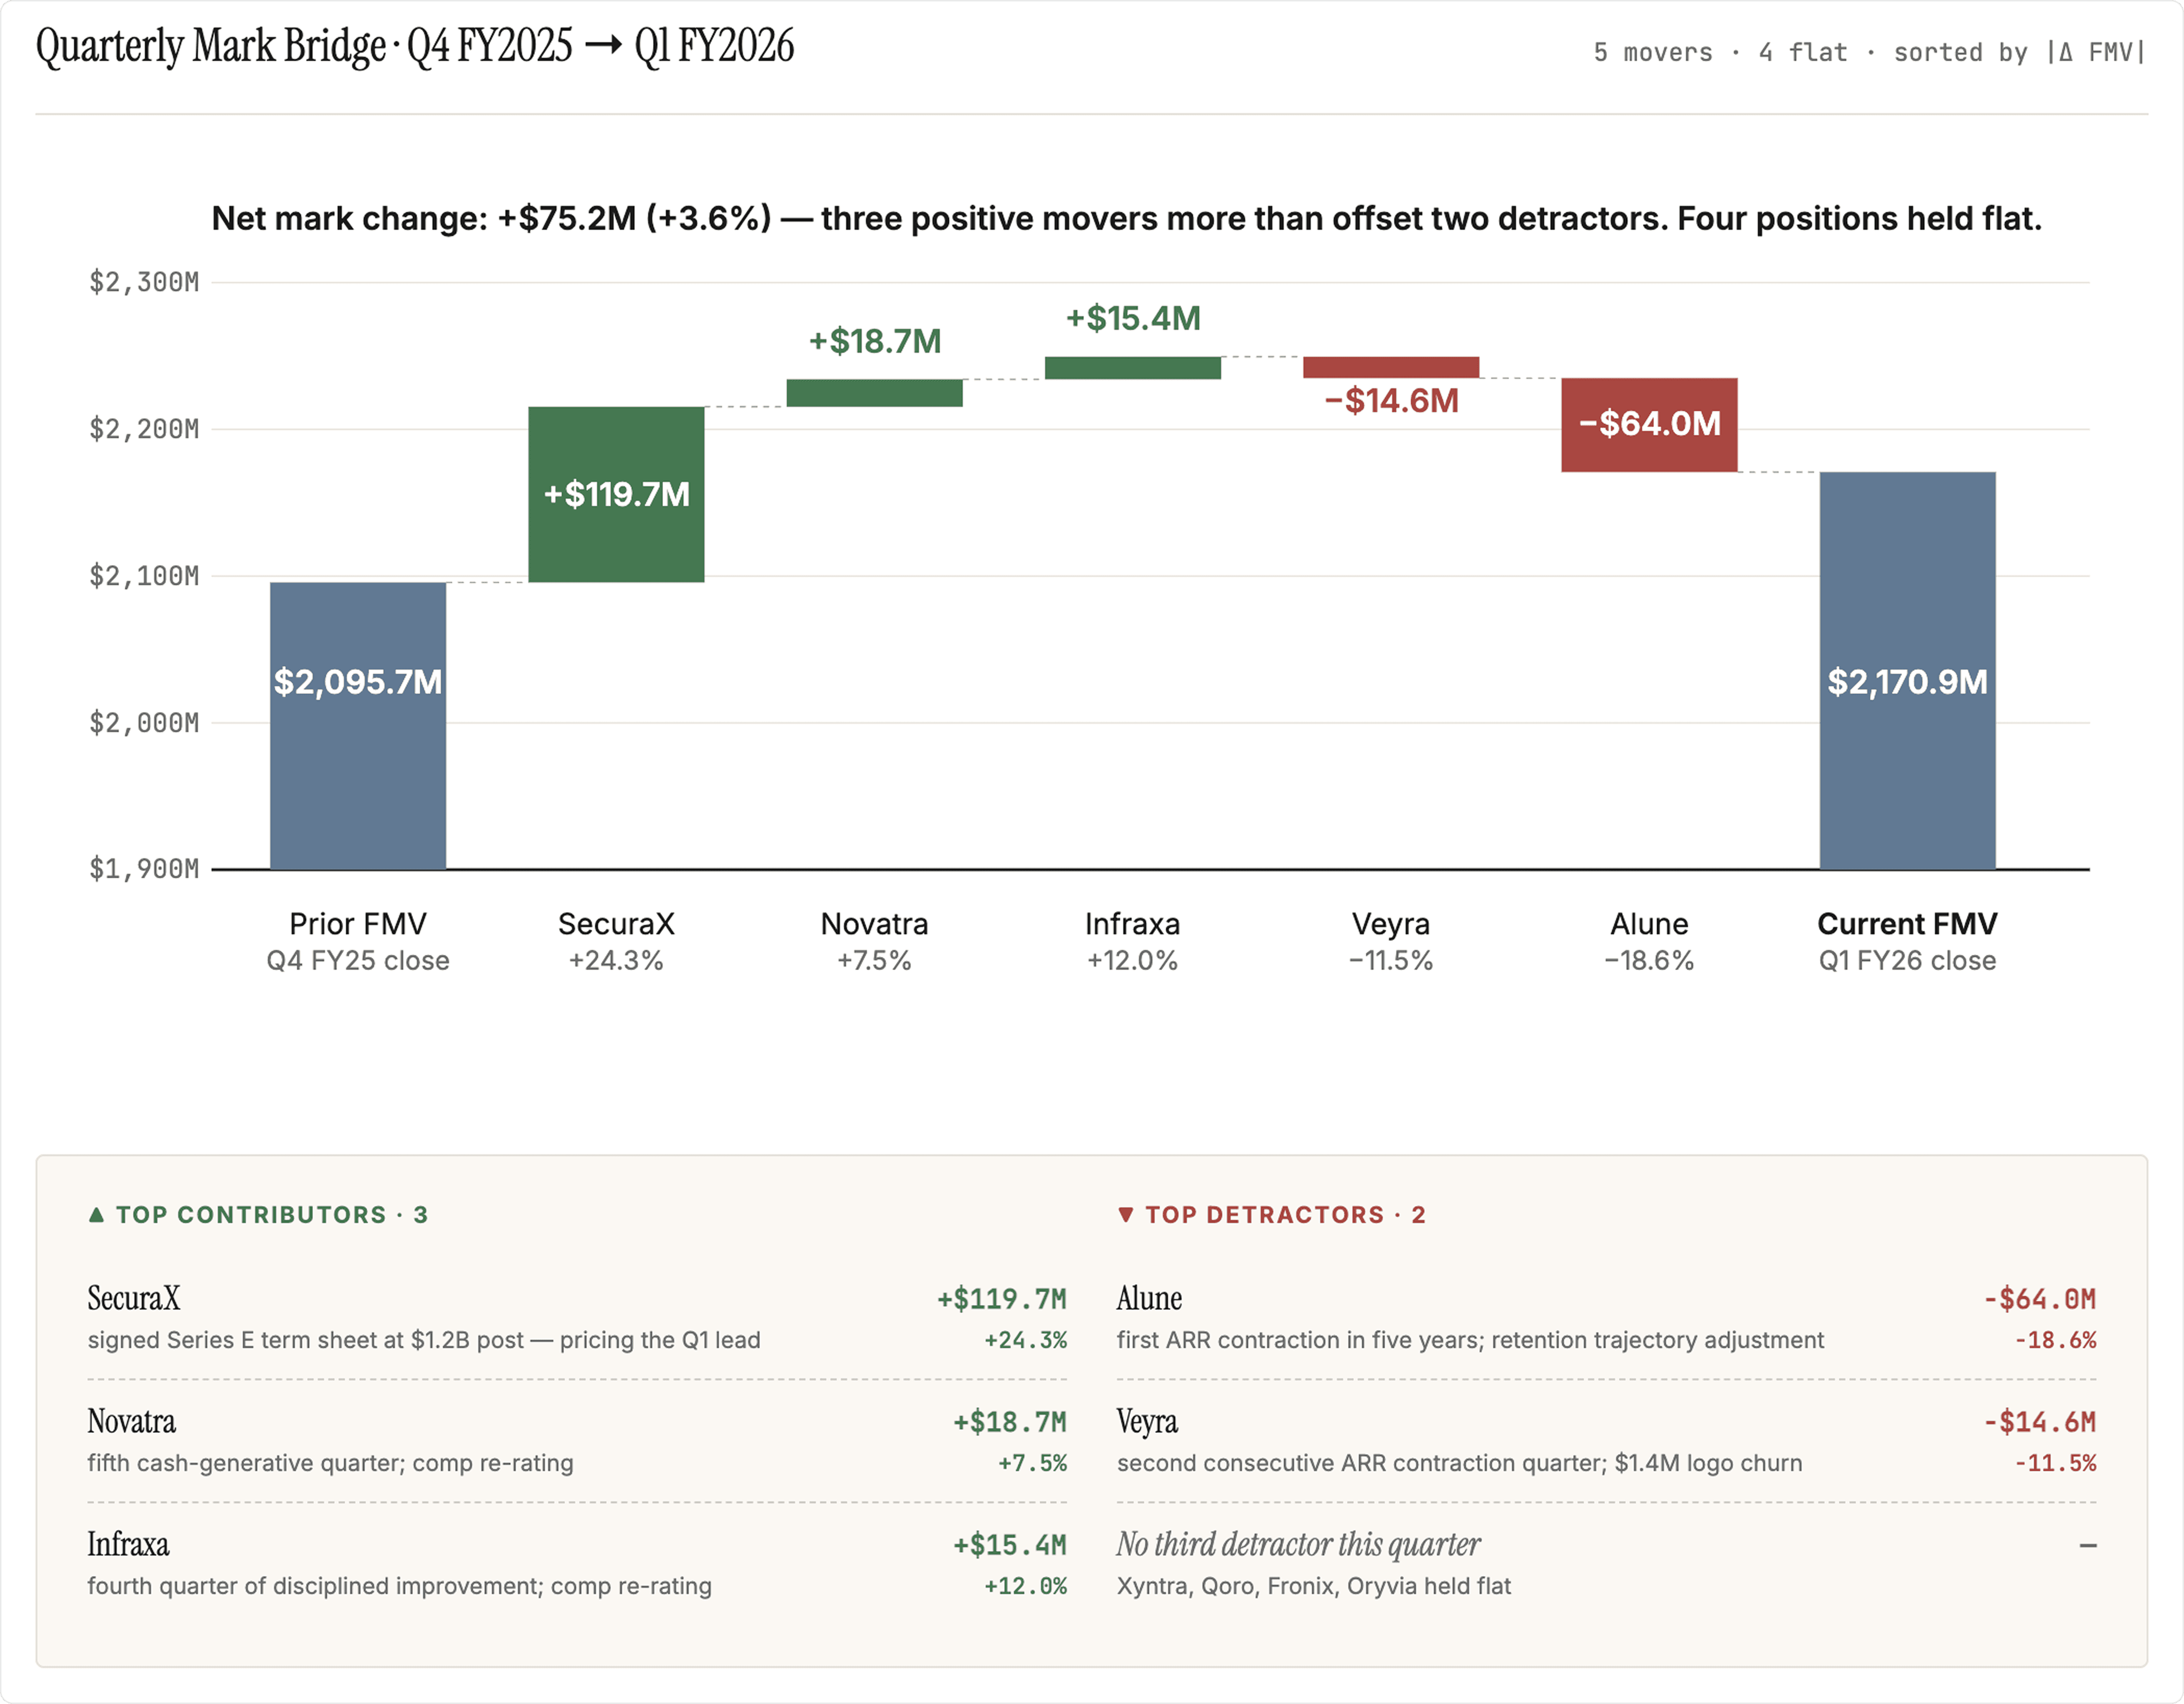
  1. Breakdown across biggest movers

The “why” behind each mark change comes from your own judgment. Use AI to create a simple waterfall chart showing the top contributors and detractors, each with a short one-line explanation.

Prepare your data
  • Step 1's data

  • Per-holding mark change and one-line attribution per mover (from Q1 board materials)

Prompt

From the per-holding mark changes, build a contribution waterfall: - Bar 1: prior-quarter total FMV - Middle bars: each non-flat position's $ mark change, sorted by magnitude descending — green for positive, red for negative - Bar N: current-quarter total FMV - Connector lines between bars showing the running balance Below the waterfall, list the top contributors and top detractors with: position name, $ change, % change, and a one-line attribution grounded in PIQ data and Q1 documents. If a side has fewer than 3 entries, show what you have and note the count.

From the per-holding mark changes, build a contribution waterfall: - Bar 1: prior-quarter total FMV - Middle bars: each non-flat position's $ mark change, sorted by magnitude descending — green for positive, red for negative - Bar N: current-quarter total FMV - Connector lines between bars showing the running balance Below the waterfall, list the top contributors and top detractors with: position name, $ change, % change, and a one-line attribution grounded in PIQ data and Q1 documents. If a side has fewer than 3 entries, show what you have and note the count.

Copy prompt

Copied

Output
Quarterly portfolio valuation bridge waterfall chart

This analysis was one-shotted with Claude + PortfolioIQ MCP

This analysis was one-shotted with Claude + PortfolioIQ MCP

AI does great analysis, getting the data ready is the hard part

AI does great analysis, getting the data ready is the hard part

AI does great analysis, getting the data ready is the hard part

PortfolioIQ manages your data: extraction from documents, standardization, reconciliation across sources and human checks. Plugs latest, accruate data to wherever you do your work. Claude, ChatGPT, Excel or the PortfolioIQ platform.