Blog
•
Anthology: Ecommerce & Marketplace Metrics in stories

It's 2 AM. You're craving a Hamburger. The In-N-Out nearby is closed, but DoorDash delivers you one with extra cheese from a restaurant open 15 miles away in 30 minutes. The next morning, you realize you're out of laundry detergent; Zepto arrives in 20 minutes. The same evening, you remember your friend's birthday is the day after. Etsy has a handmade gift ready to ship tomorrow.
This is what ecommerce and marketplaces did: they collapsed time and geography. A seller in Vermont reaches customers in London. A buyer in Tokyo browses 5 million products at midnight. A physical store can only serve a few city blocks; an online platform can serve entire continents, without needing a storefront in each one.
For businesses, it meant starting with a laptop instead of a lease, scaling without opening new locations, and using data to know what customers want, before they ask for it. For customers, it meant comparing prices across continents in seconds, getting recommendations that actually match their taste, and having everything delivered to their door.
The model works because it's efficient. But efficiency doesn't guarantee survival.
The gap between a company that looks like it's growing and one that's actually building compounding value often comes down to a single metric that nobody's watching closely enough.
Every metric below is drawn from real companies - some that built empires, others that lost millions. They're case studies of what happens when you either master these metrics or ignore them. Knowing which numbers to believe separates prescient investments from expensive mistakes.
Below are the 7 metrics that determine which platforms win.
GMV
Gross Merchandise Value (GMV) represents the total dollar value of all goods or services sold through a platform over a specific period (e.g., monthly, quarterly, or annually).
GMV is the top-line indicator of scale. It shows how much economic activity is flowing through your ecosystem.
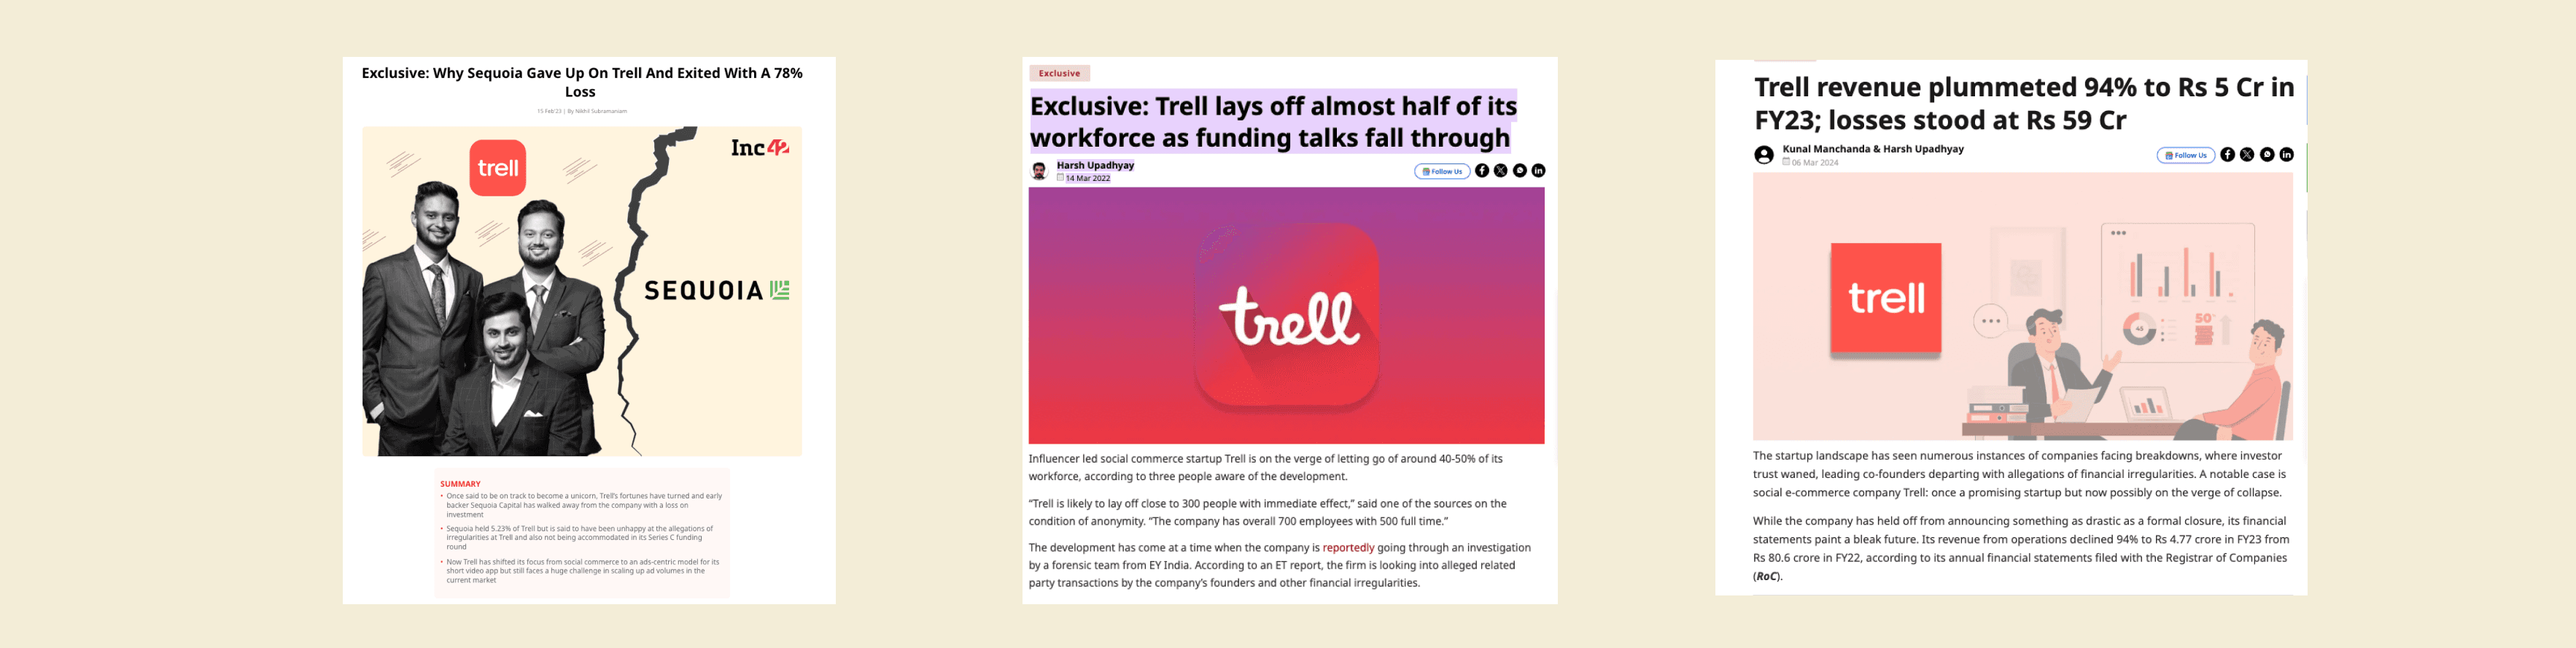
In 2021, Trell was India's hottest social commerce startup. It had 45 million monthly active users scrolling through beauty tutorials and lifestyle tips, watching three-minute videos that ended in a "Buy Now" button. Trell earned a commission from every sale.
In July, it raised $45 million at a $120 million valuation from Mirae Asset and H&M. By October, Amazon was preparing to lead a $100 million round that would value Trell between $600M to 800M - nearly six times higher in just three months.
But in 2022, things started falling apart. A whistleblower’s note to one of its investors, Sequoia India, had triggered a forensic audit by EY. Trell's GMV was revealed to be artificially inflated by 30-40%, through automated bots creating fake transactions.
The funding round stalled. 300 of Trell's 700 employees were laid off. Commission revenue collapsed 95% - from $5.08 million in 2022 to $0.25 million in 2023. By early 2023, Trell abandoned social commerce entirely, pivoting to a short-video app, and shortly after, Sequoia exited with an 80% loss.
GMV was foundational in showing that Trell wasn’t just getting traffic - people were actually spending money in thousands of transactions. When it turned out to be faked, the near unicorn valuation vanished and the business collapsed.
(Sources: 1 2 3 4 5 6 7 8 9 10)
Take Rate
Take Rate (also known as rake or commission or transaction fees) is the percentage of the Gross Merchandise Value that a marketplace or platform collects as revenue for facilitating a transaction.
While GMV measures the total "pie" of economic activity, the Take Rate determines how much of that pie the platform actually gets to keep.
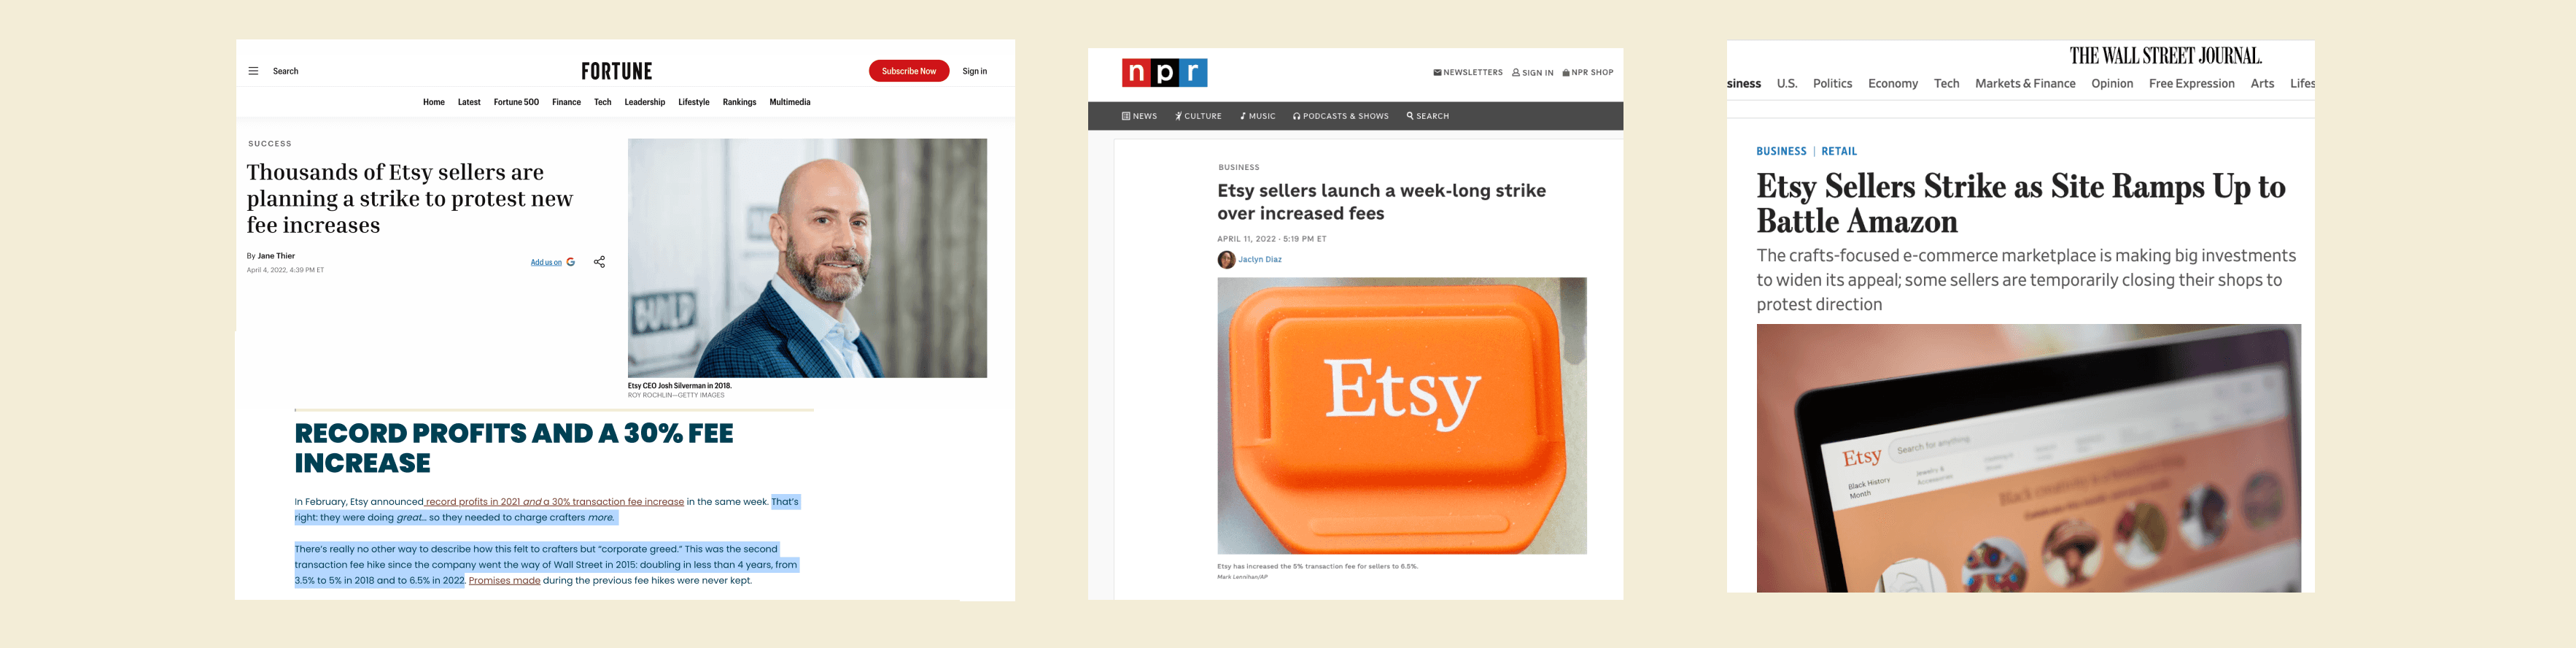
In February 2022, Etsy told sellers they'd raise the take rate from 5% to 6.5%. Sellers were furious. The timing felt like a slap in the face - Etsy just had its best quarter ever at $717 million in revenue, and now they wanted sellers to pay more?
Thousands planned a week-long strike, gathering over 80,000 petition signatures. NPR covered it. CNN covered it. Sellers demanded Etsy cancel the increase.
Etsy refused.
Three months later, Etsy released its earnings report - Revenue was up 10%, and they were still adding six to seven million new buyers quarterly. On the earnings call, CEO Silverman calmly noted, "seller sentiment has rebounded pretty significantly since the fee change went into effect."
The strike had failed. Only 5,000 of the 5.3 million sellers on Etsy actually participated - less than 0.3%. The rest kept selling. The strikers had nowhere else to go. Etsy had 90 million buyers shopping for handmade and vintage items. Amazon Handmade charged double Etsy's new rate. Shopify required driving your own traffic. No marketplace came close. Sellers had spent years building their shops. Leaving meant abandoning everything.
Etsy effectively raised the take rate 30% without sellers fleeing. This was a testament to Etsy’s pricing power and the real value it was providing to its users.
(Sources: 1 2 3 4 5 6 7 8 9 10 11 12 13 14)
GMV Cohort Retention
GMV Cohort Retention measures the total spending of a specific customer group over time relative to their initial spend. It tracks dollar value - accounting for frequency and basket size, rather than just logins. Retention above 100% proves your marketplace is gaining "share of wallet" and becoming increasingly sticky.
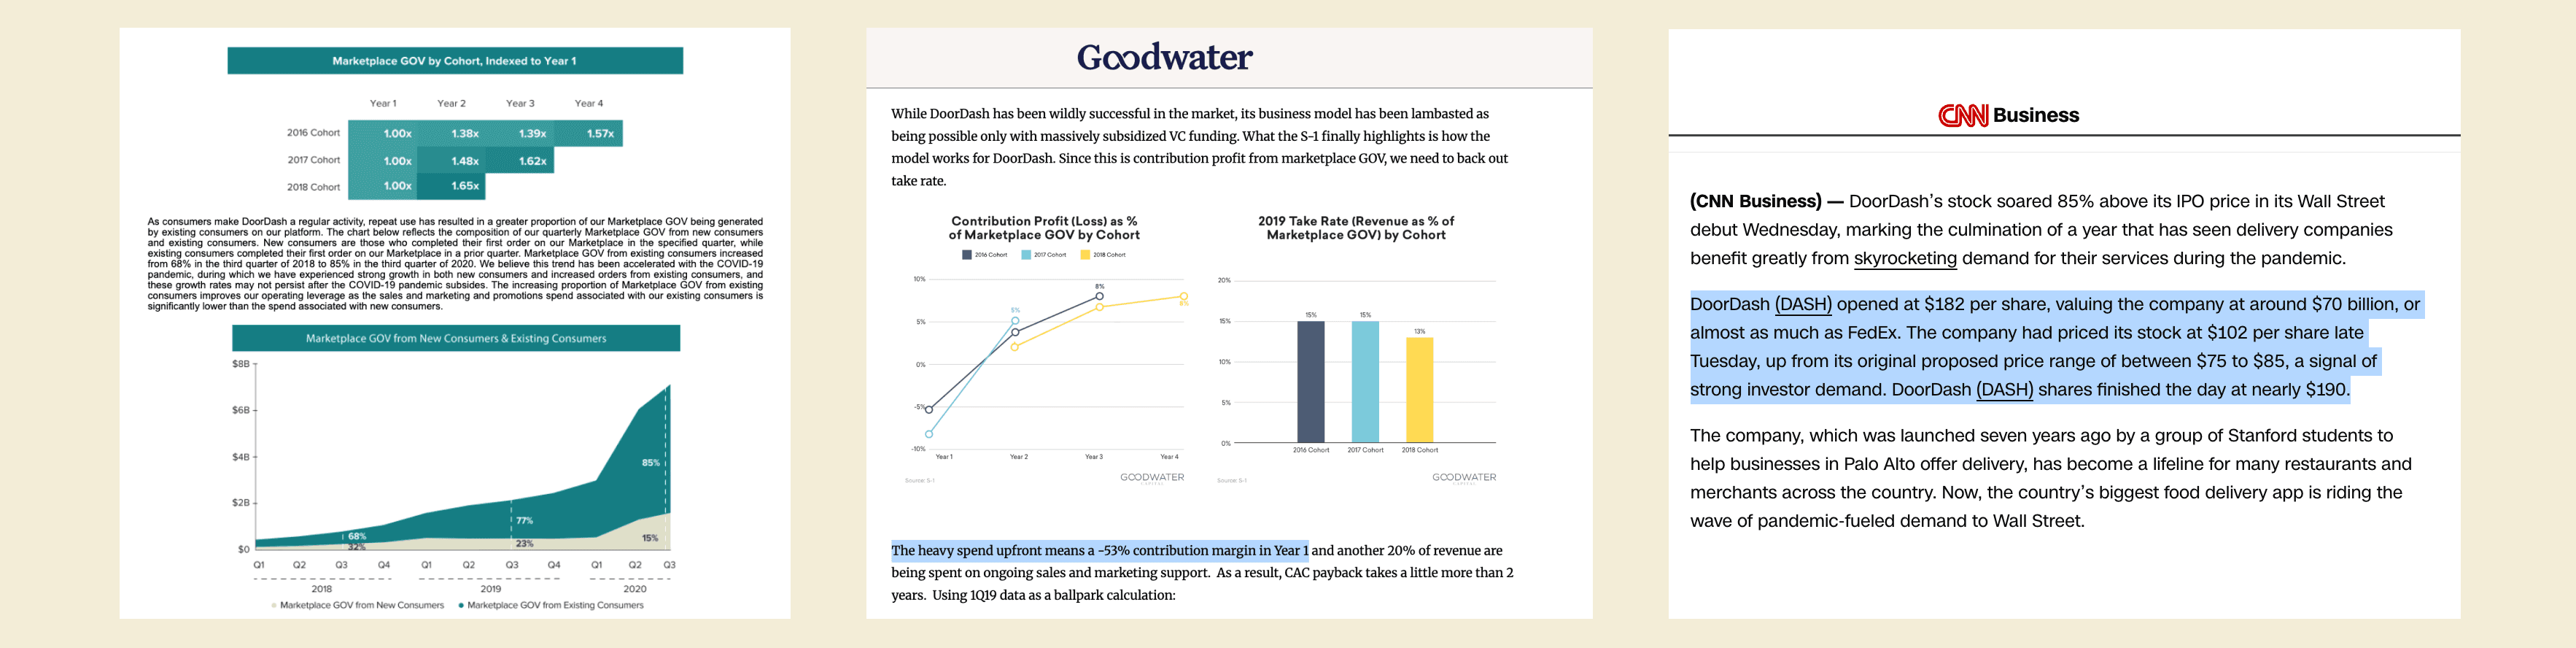
In late 2020, from its San Francisco SOMA office, DoorDash filed paperwork that would trigger one of the most puzzling IPO valuations in recent memory. According to Goodwater Capital's research, Doordash had long been criticized for low margins and was “heavily subsidized by investor capital." The company had been losing money on nearly every new customer's order.
Yet when DoorDash started trading on December 9, 2020, it opened at a mouth-watering $182 per share - a $68 billion valuation. This wasn’t making sense at all.
DoorDash was being valued at 17 times revenue, while Uber was valued at less than 8 times revenue, and GrubHub agreed to be acquired earlier that year for under 4 times revenue. DoorDash commanded a significant premium to competitors despite similar pandemic tailwinds. So, the market was pricing in more than just COVID demand.
The valuation gap came down to one thing: customer behavior over time.
DoorDash's S-1 revealed the 2016 cohort increased spending 57% by year four - in cohort math - 1.00x spend in year one to 1.57x by year four. Even more striking, the 2018 cohort spent 65% more (1.65x) by year two! Newer cohorts ramped faster, showing DoorDash was getting better at increasing spending. By Q3 2020, 85% of total GMV came from existing customers.
As customers placed their 20th, 30th, 50th order over time, the upfront customer acquisition cost got spread across far more transactions. The negative margin became positive. Cohort retention explained what looked irrational on the surface - and correctly justified an inevitable winner.
(Sources: 1 2 3 4 5 6 7 8 9)
Average Order Value
Average Order Value (AOV) tracks the average dollar amount spent every time a customer places an order. It is a "depth" metric, focusing on how much each transaction is worth rather than the "width" metric of how much total traffic you are getting.
It was seven o'clock on a Saturday evening when the hunger struck - the ravenous, all-consuming type that rendered cooking utterly impossible. You summoned DoorDash. A driver would arrive bearing pasta like a guardian angel in a Honda Civic. You paid $31.
Sunday morning arrived with good intentions and a half-empty refrigerator. This required strategy. You opened Instacart: flour, cheese, tomatoes, spinach. The building blocks of proper home-cooked meals for the week. This time, you paid $113.
It cost both platforms $2-3 to deliver your order. On your $31 order, that delivery cost ate up 7% of the total. On your $113 order, barely 2.5%. After covering the direct costs, DoorDash had roughly $2 in gross profit left from your order. Instacart had $8.65.
It's not that Instacart is a better company than DoorDash because of its high average customer order value. Their AOV revealed the unique "mastery" both required as platforms to generate long-term value.
DoorDash must obsess over frequency - push notifications, loyalty programs, daily deals to get you ordering multiple times weekly. Instacart can afford patience - twice-monthly grocery hauls work fine. They focus on basket-building features, product recommendations, customer service to maximize each transaction.
AOV is the gravity that defines which way your business must climb to survive.
When a founder pitches a low-AOV business but doesn’t focus on retention, or a high-AOV business but obsesses over daily active users, they’ve clearly got it wrong.

(Sources: 1 2 3 4 5 6 7)
LTV/CAC
LTV/CAC measures unit economic efficiency by comparing a customer’s lifetime gross profit to their acquisition cost. Industry leaders like a16z use 3x LTV:CAC as a rough benchmark of a consumer company’s financial health. Higher LTV/CAC leads to higher margins and thus, better valuations
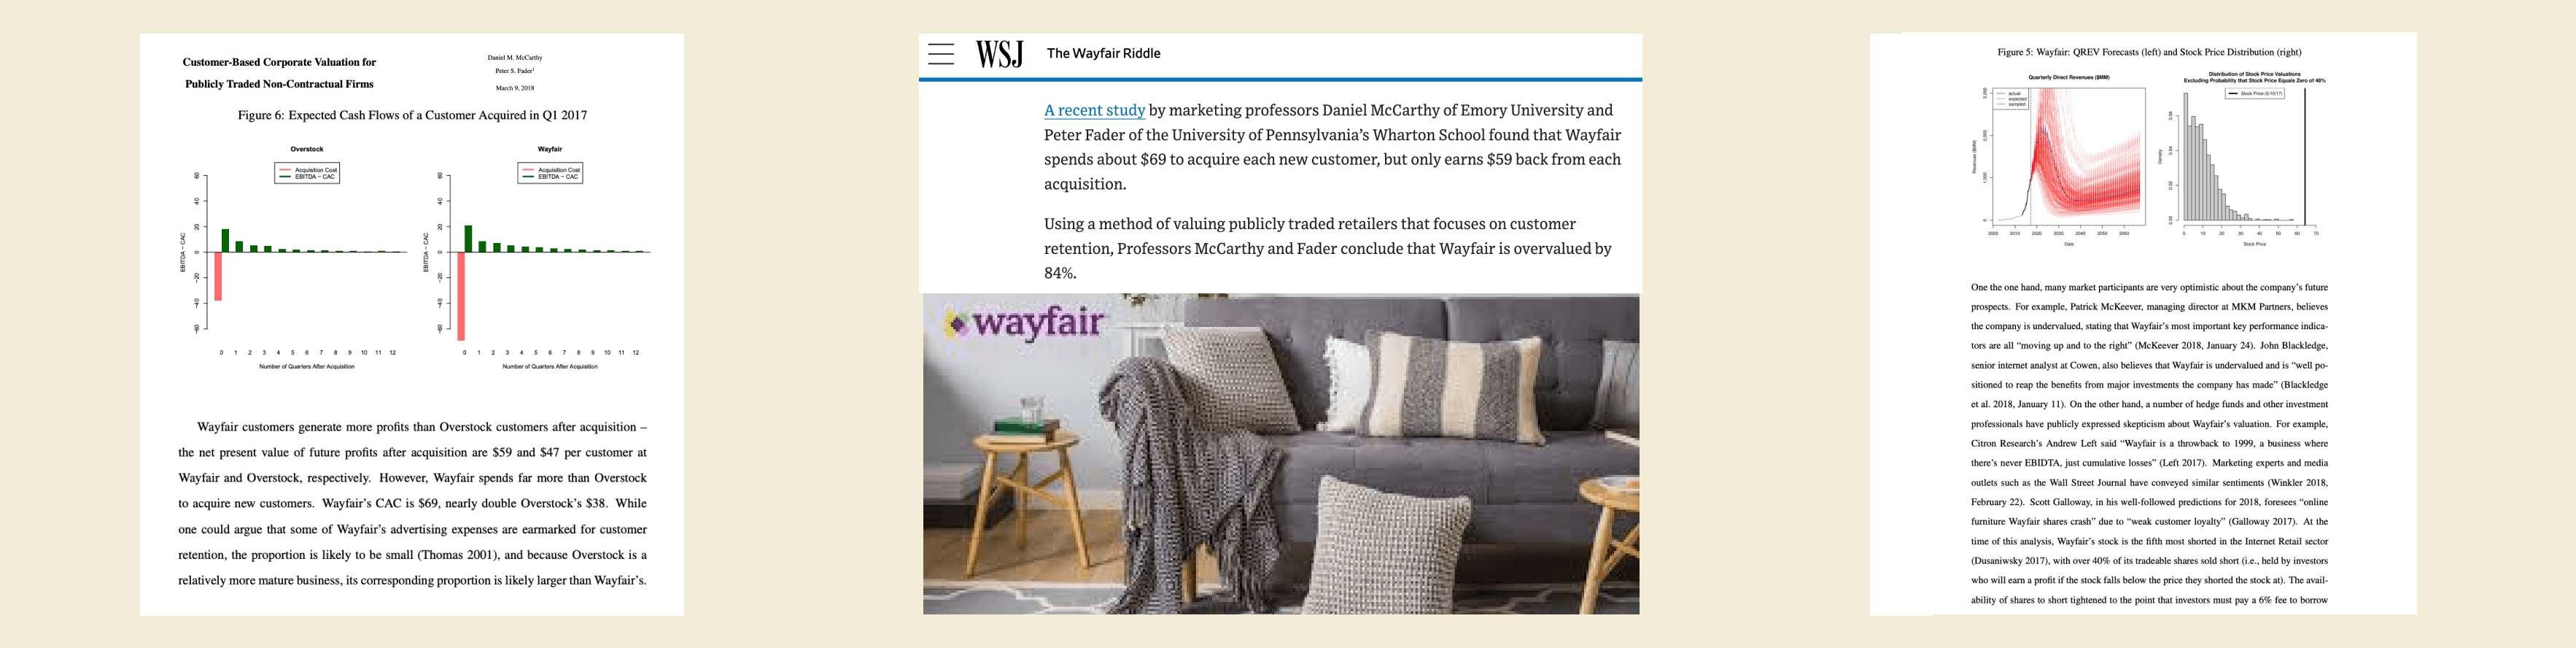
Wayfair was losing $10 on every customer it acquired.
On the surface, the online furniture retailer looked unstoppable. Revenue was $4.3 billion in 2017, and the stock had surged 115% in a year to an $8 billion valuation. Then where were things going wrong, and why was it losing money on every customer it acquired?
Marketing professors Daniel McCarthy (Emory University) and Peter Fader (Wharton) analyzed Wayfair's customer data and discovered that it was spending $69 to acquire each customer, earning back only $59 over that customer's lifetime, losing $10 per customer. This translates to an LTV/CAC ratio of $59 ÷ $69 = 0.86. For every dollar Wayfair spent acquiring customers, it got back only 86 cents.
The data also revealed a brand recognition gap. Only 9% of Wayfair's traffic came from people searching for "Wayfair" - compared to 60-70% for competitors like Restoration Hardware and Williams-Sonoma. Without organic demand, the company paid heavily for customers who didn't deliver enough value. And this was one of the main culprits behind their LTV/CAC being so low. They had to constantly spend heavily on Customer Acquisition.
McCarthy and Fader's conclusion: Wayfair was overvalued by 84%.
Some investors had already taken notice - 40% of Wayfair's available shares were sold short, making it one of the most shorted stocks in internet retail. Short sellers were betting on the stock price crashing.
While Wayfair's $4.3 billion in revenue looked impressive, but the 0.86 LTV/CAC meant the company was actually torching value with every new customer it celebrated acquiring - so it wasn’t doing good after all.
(Sources: 1 2 3 4)
Contribution Margin
Contribution margin measures whether each order makes or loses money after covering variable costs: delivery, discounts, fulfillment, packaging. It's calculated as revenue minus these variable costs. The contribution margin then goes toward covering fixed costs like rent and salaries; once those are paid, what's left becomes profit.
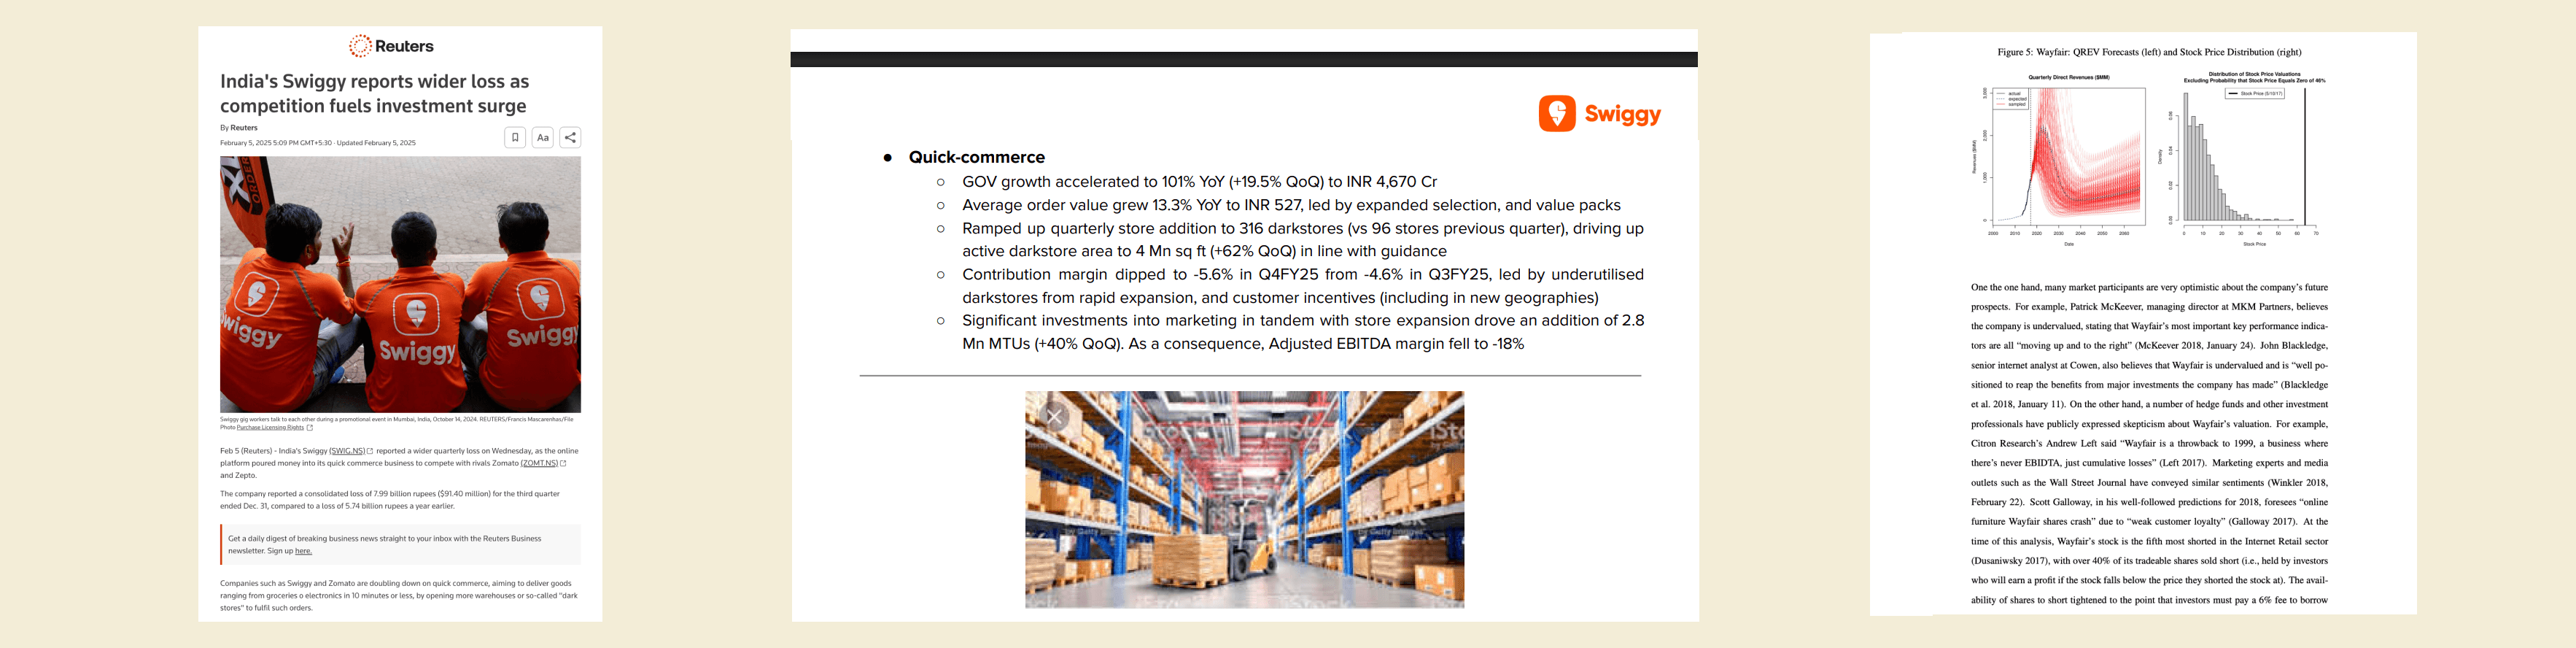
Swiggy, one of India's largest food delivery platforms with millions of daily orders, spotted a new gold rush in 2024: ten-minute grocery delivery. As rival Zomato's Blinkit dominated the market, Swiggy poured money into its quick-commerce arm, Instamart, opening 316 warehouses in a single quarter - quadruple its previous pace.
Swiggy's contribution margin - revenue minus variable costs like delivery, discounts, and warehouse operations, collapsed from -1.9% to -5.6% in two quarters.
It was because nearly half their heavily-invested in - warehouses were brand new, still operating below capacity; another reason was because they’d increased customer discounts to 2.5% to lure people in new cities to make purchases. These variable costs - delivery, discounts, warehouse operations - began devouring revenue faster than revenue came in.
Fixed costs, like office rent or salaries, existed whether Swiggy delivered one order or one million. Contribution margin revealed if each additional order moved it towards making more money. With it being negative and worsening, growth accelerated the losses.
In late 2024, Swiggy’s losses widened 39%. Stock prices fell.
In 2025, Swiggy forecasted 3-5 quarters until each order stops losing money - only then would they start turning profitable.
(Sources: 1 2 3 4)
Repurchase Rate
Any analysis should start with the same core assumption: repeat customers are the lifeblood of your business. Measuring the velocity of their return, and the value they contribute upon each return, is the most objective way to measure your performance.
- Alex Taussig Partner, LSVP
Repurchase Rate (also known as Repeat Rate or Repeat Purchase Rate) measures whether customers come back. You can track it two ways: revenue-based (% of revenue from returning customers) or customer-based (% of customers who buy more than once). For ecommerce and marketplaces, success is getting customers to that second purchase.
A box arrives with five curated pieces. You keep two, send back three, and tell them why: "Loved the blazer's fit, hated the ruffles." Next month, four pieces arrive. They feel perfect. The algorithm just learned your style.
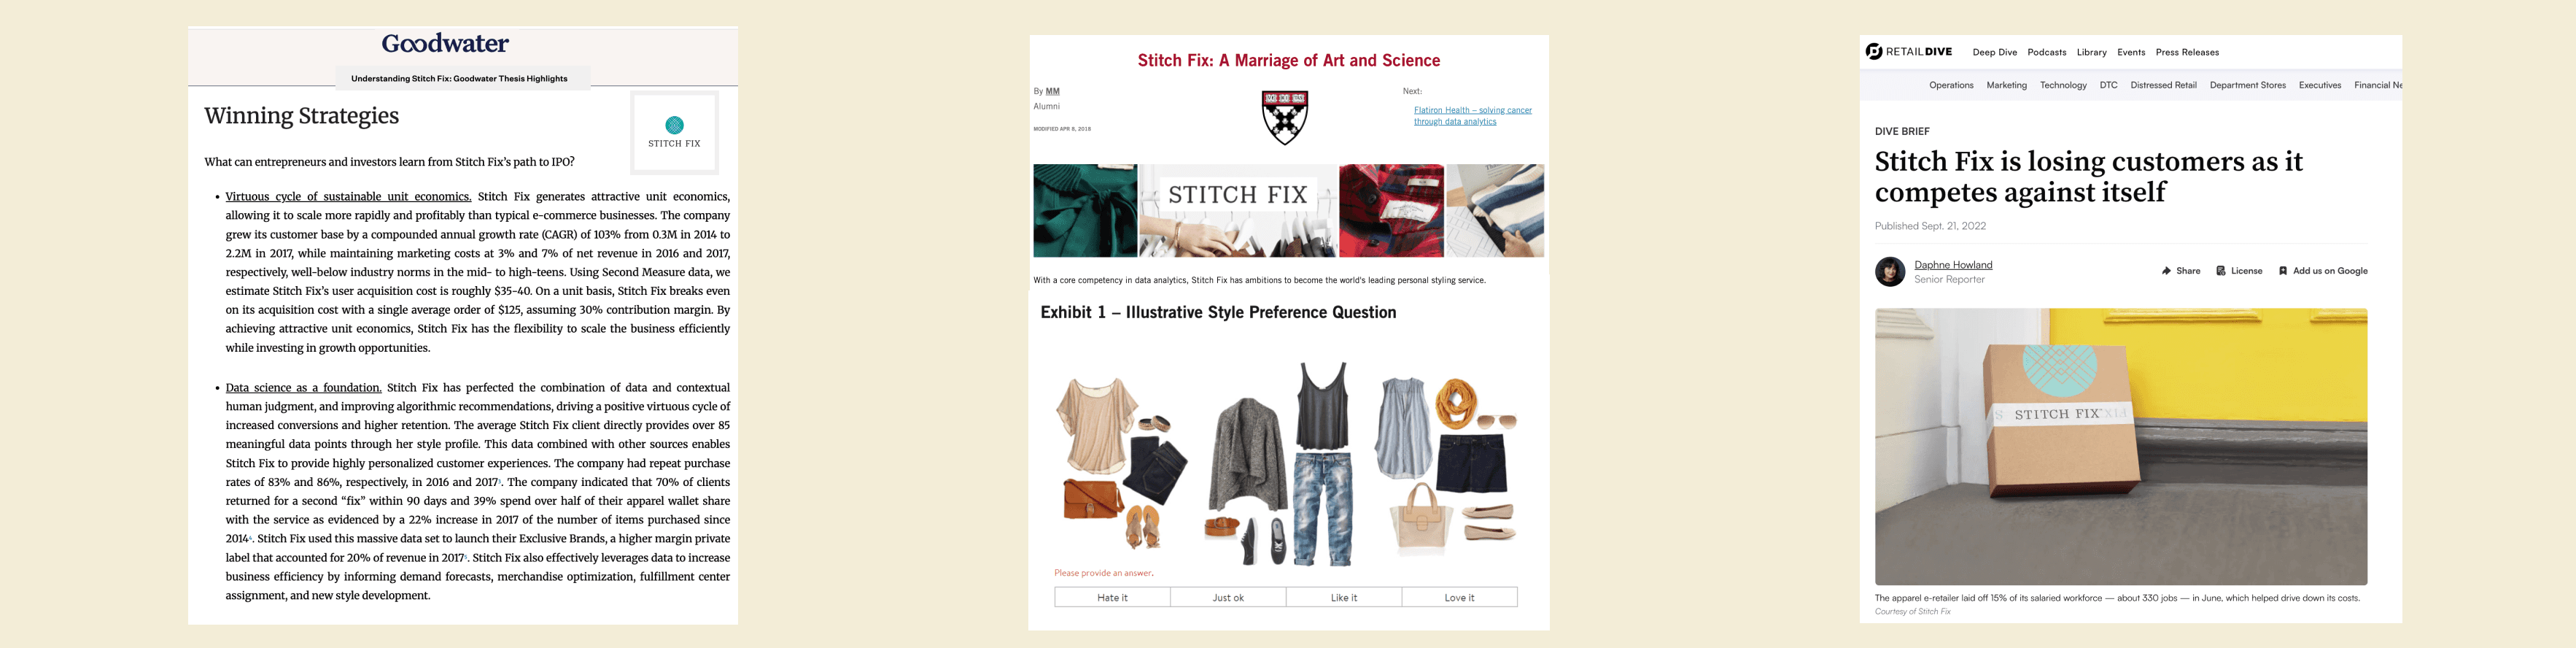
This feedback loop powered Stitch Fix's rise. Every box felt like a gift - you never knew what would arrive, but it kept getting more you. That personal touch made customers feel understood in a way browsing endless catalogs never could.
In 2017, Stitch Fix achieved an 86% repeat rate - 86% of revenue came from returning customers. The company grew from 0.3 million to 2.2 million customers between 2014 and 2017 while spending just 3-7% of their revenue on marketing, well below the 15-19% industry norm. Stitch Fix collected feedback on 85% of shipments, claiming a 63% probability of predicting what each customer would buy. By 2021, they hit $2 billion in revenue.
Then in September 2021, they launched Freestyle - customers could buy items directly from the site instead of receiving curated boxes. Freestyle broke the habit that the subscription model had forced: repeat purchases. By 2025, they'd lost half their customers - from 4.2 million to 2.3 million. Revenue fell.
When repeat purchases stopped, growth reversed.
Apart from merely selling products, Ecommerce and marketplaces also quietly build habits that keep customers coming back, wanting more. Stitch Fix broke the incredible habit loop that differentiated them from the rest, that made them reach their peak, and so, suffered heavily.